 https://treasuryxl.com/wp-content/uploads/2025/04/GTreasury-BLOGS-featured-10.png
200
200
treasuryXL
https://treasuryxl.com/wp-content/uploads/2018/07/treasuryXL-logo-300x56.png
treasuryXL2025-06-18 07:00:192025-06-13 06:58:175 Silent Killers of Cash Flow Forecasting Accuracy and How to Eliminate Them
https://treasuryxl.com/wp-content/uploads/2025/04/GTreasury-BLOGS-featured-10.png
200
200
treasuryXL
https://treasuryxl.com/wp-content/uploads/2018/07/treasuryXL-logo-300x56.png
treasuryXL2025-06-18 07:00:192025-06-13 06:58:175 Silent Killers of Cash Flow Forecasting Accuracy and How to Eliminate ThemAs a corporate treasurer, it is crucial to have a deep understanding of your organization’s cash position at all times. In today’s dynamic business environment, cash forecasting has become an essential tool for treasury management. By predicting future cash flows, treasurers can make informed decisions to ensure that their organization has adequate liquidity to meet its financial obligations.
What is Cash Forecasting?
Cash forecasting is the process of predicting future cash flows based on historical data and expected changes in the organization’s financial activities. A cash forecast provides treasurers with valuable insights into their organization’s future cash position, enabling them to make informed decisions on how to allocate cash resources.
Benefits of Cash Forecasting
Cash forecasting provides several benefits for corporate treasurers, including:
- Improved Cash Management: By providing visibility into future cash flows, treasurers can manage their organization’s cash position more effectively, ensuring that they have the necessary liquidity to meet their financial obligations.
- Enhanced Financial Planning: Cash forecasting allows treasurers to identify potential cash shortfalls or surpluses and take proactive steps to manage their organization’s cash position accordingly.
- Better Decision Making: With accurate cash forecasts, treasurers can make informed decisions on cash management strategies, such as investing surplus cash or securing additional funding to cover cash shortfalls.
Cash Forecasting Strategies
Several cash forecasting strategies can be used by corporate treasurers to predict future cash flows, including:
- Bottom-up forecasting: This approach involves aggregating data from individual business units to create an organization-wide cash forecast.
- Top-down forecasting: This approach involves starting with the organization’s overall financial goals and then breaking them down into cash flow projections.
- Hybrid forecasting: This approach combines both top-down and bottom-up forecasting methods to provide a more accurate cash forecast.
Cash Flow Forecast Formula
The cash flow forecast formula is a simple yet powerful tool that can be used to create a cash flow forecast. It involves estimating cash inflows and outflows over a given period, such as a month or a quarter. The formula is as follows:
Cash inflows – Cash outflows = Net cash flow
How to Create a Cash Flow Forecast
To create a cash flow forecast, treasurers can follow these steps:
- Collect historical data on cash inflows and outflows, such as sales receipts, accounts payable, and accounts receivable.
- Estimate future cash inflows and outflows based on expected changes in the organization’s financial activities.
- Use a cash forecasting model or software to aggregate and analyze the data, generating a cash forecast for a given period.
Cash Forecasting Software
Cash forecasting software options are available in the market, providing treasurers with valuable tools to manage their organization’s cash position. Cash forecasting software can automate the forecasting process, improve accuracy, and provide real-time visibility into the organization’s cash position. Partners of treasuryXL provide excellent Cash Forecasting Software.
Conclusion
Cash forecasting is an essential tool for corporate treasurers, enabling them to manage their organization’s cash position more effectively. By providing visibility into future cash flows, treasurers can make informed decisions on cash management strategies, improving financial planning and decision-making. With the help of cash forecasting models, formulas, and software, treasurers can generate accurate cash forecasts and ensure that their organization has the necessary liquidity to meet its financial obligations.
Click and Scroll! Here are more articles that you might like…
 https://treasuryxl.com/wp-content/uploads/2025/04/GTreasury-BLOGS-featured-10.png
200
200
treasuryXL
https://treasuryxl.com/wp-content/uploads/2018/07/treasuryXL-logo-300x56.png
treasuryXL2025-06-18 07:00:192025-06-13 06:58:175 Silent Killers of Cash Flow Forecasting Accuracy and How to Eliminate Them
 https://treasuryxl.com/wp-content/uploads/2025/05/GTreasury-BLOGS-featured-12.png
200
200
treasuryXL
https://treasuryxl.com/wp-content/uploads/2018/07/treasuryXL-logo-300x56.png
treasuryXL2025-05-27 07:00:212025-05-27 08:54:00Cash Forecasting Accuracy Measurement
 https://treasuryxl.com/wp-content/uploads/2025/01/Nomentia-BLOGS-featured-1.png
200
200
treasuryXL
https://treasuryxl.com/wp-content/uploads/2018/07/treasuryXL-logo-300x56.png
treasuryXL2025-05-20 07:00:332025-05-19 14:03:02Sanctions screening compliance excuses, debunked
 https://treasuryxl.com/wp-content/uploads/2025/05/Francois-Template_BLOGS-Expert-featured-7.png
200
200
treasuryXL
https://treasuryxl.com/wp-content/uploads/2018/07/treasuryXL-logo-300x56.png
treasuryXL2025-05-15 07:00:252025-05-06 14:23:53Treasury Management and Credit Collections
 https://treasuryxl.com/wp-content/uploads/2025/01/Nomentia-BLOGS-featured-1.png
200
200
treasuryXL
https://treasuryxl.com/wp-content/uploads/2018/07/treasuryXL-logo-300x56.png
treasuryXL2025-04-24 07:00:162025-04-22 14:39:41Best liquidity management strategies for multinational enterprises
 https://treasuryxl.com/wp-content/uploads/2024/07/Template_BLOGS-featured-1.png
200
200
treasuryXL
https://treasuryxl.com/wp-content/uploads/2018/07/treasuryXL-logo-300x56.png
treasuryXL2025-04-22 07:00:292025-04-18 14:19:09Managing Corporate Treasury with Spreadsheets
 https://treasuryxl.com/wp-content/uploads/2025/04/Francois-Template_BLOGS-Expert-featured-6.png
200
200
treasuryXL
https://treasuryxl.com/wp-content/uploads/2018/07/treasuryXL-logo-300x56.png
treasuryXL2025-04-17 07:00:042025-04-16 16:56:09Strategic Treasury & Cash Management 2.0 Masterclass
 https://treasuryxl.com/wp-content/uploads/2025/04/Nomentia-BLOGS-featured-2.png
200
200
treasuryXL
https://treasuryxl.com/wp-content/uploads/2018/07/treasuryXL-logo-300x56.png
treasuryXL2025-04-15 11:45:382025-04-15 11:45:38Nomentia Unveils AI Cash Flow Forecasting for Accurate & Predictive Insights
 https://treasuryxl.com/wp-content/uploads/2025/01/Nomentia-BLOGS-featured-1.png
200
200
treasuryXL
https://treasuryxl.com/wp-content/uploads/2018/07/treasuryXL-logo-300x56.png
treasuryXL2025-04-07 07:00:542025-04-03 11:16:22Cash pools and in-house bank – Everything you need to know
 https://treasuryxl.com/wp-content/uploads/2025/01/Nomentia-BLOGS-featured-1.png
200
200
treasuryXL
https://treasuryxl.com/wp-content/uploads/2018/07/treasuryXL-logo-300x56.png
treasuryXL2025-03-26 07:00:562025-03-25 21:48:49Why Excel fails at cash flow forecasting?
 https://treasuryxl.com/wp-content/uploads/2025/03/Live-Session-AB-1-1.png
200
200
treasuryXL
https://treasuryxl.com/wp-content/uploads/2018/07/treasuryXL-logo-300x56.png
treasuryXL2025-03-20 07:00:532025-03-31 16:39:22Recap & Recording: Self-Service Treasury: Excel, APIs, AI, and Other Practical Tools
 https://treasuryxl.com/wp-content/uploads/2025/03/Embat-BLOGS-featured-4.png
200
200
treasuryXL
https://treasuryxl.com/wp-content/uploads/2018/07/treasuryXL-logo-300x56.png
treasuryXL2025-03-19 08:00:102025-04-24 17:19:05Building a Smarter Treasury: The Embat Story
 https://treasuryxl.com/wp-content/uploads/2024/07/Template_BLOGS-featured-1.png
200
200
treasuryXL
https://treasuryxl.com/wp-content/uploads/2018/07/treasuryXL-logo-300x56.png
treasuryXL2025-03-04 07:00:302025-02-28 11:17:57Corporate Treasury’s relationship with their IT department
 https://treasuryxl.com/wp-content/uploads/2025/02/Embat-BLOGS-featured-3.png
200
200
treasuryXL
https://treasuryxl.com/wp-content/uploads/2018/07/treasuryXL-logo-300x56.png
treasuryXL2025-02-25 10:31:452025-02-25 10:33:31Embat acquires Necto, strengthening its leadership in global corporate banking connectivity through APIs
 https://treasuryxl.com/wp-content/uploads/2024/07/Template_BLOGS-featured-1.png
200
200
treasuryXL
https://treasuryxl.com/wp-content/uploads/2018/07/treasuryXL-logo-300x56.png
treasuryXL2025-02-20 07:00:502025-02-19 16:37:44Managing KYC & AML in Corporate Treasury
 https://treasuryxl.com/wp-content/uploads/2024/10/Embat-BLOGS-featured-2.png
200
200
treasuryXL
https://treasuryxl.com/wp-content/uploads/2018/07/treasuryXL-logo-300x56.png
treasuryXL2025-02-11 07:00:212025-02-07 09:30:24Direct and Indirect Cash Forecasting: Advantages and Disadvantages
 https://treasuryxl.com/wp-content/uploads/2024/07/Template_BLOGS-featured-1.png
200
200
treasuryXL
https://treasuryxl.com/wp-content/uploads/2018/07/treasuryXL-logo-300x56.png
treasuryXL2025-02-05 07:00:002025-02-04 10:13:37Measuring Corporate Treasury Performance
 https://treasuryxl.com/wp-content/uploads/2025/01/Blog-Kyriba-1.png
200
200
treasuryXL
https://treasuryxl.com/wp-content/uploads/2018/07/treasuryXL-logo-300x56.png
treasuryXL2025-01-27 08:00:062025-01-24 13:51:37Cash Forecasting: Your Blueprint for Liquidity Performance
 https://treasuryxl.com/wp-content/uploads/2024/07/Template_BLOGS-featured-1.png
200
200
treasuryXL
https://treasuryxl.com/wp-content/uploads/2018/07/treasuryXL-logo-300x56.png
treasuryXL2025-01-16 07:00:332025-01-14 16:38:00Future-proofing Global Treasury Teams
 https://treasuryxl.com/wp-content/uploads/2024/12/FIS-BLOGS-featured-4.png
200
200
treasuryXL
https://treasuryxl.com/wp-content/uploads/2018/07/treasuryXL-logo-300x56.png
treasuryXL2025-01-08 07:00:412025-01-07 10:39:33Unlocking Value: How TMS Delivers Measurable ROI for Corporate Treasury
 https://treasuryxl.com/wp-content/uploads/2024/10/Embat-BLOGS-featured-2.png
200
200
treasuryXL
https://treasuryxl.com/wp-content/uploads/2018/07/treasuryXL-logo-300x56.png
treasuryXL2024-12-09 07:00:232024-12-01 20:05:54The role of the CFO in the company’s overall strategy
 https://treasuryxl.com/wp-content/uploads/2024/07/Template_BLOGS-featured-1.png
200
200
treasuryXL
https://treasuryxl.com/wp-content/uploads/2018/07/treasuryXL-logo-300x56.png
treasuryXL2024-12-04 07:00:372024-12-16 12:00:55Corporate Treasury: Funding Working Capital
 https://treasuryxl.com/wp-content/uploads/2024/10/Embat-BLOGS-featured-2.png
200
200
treasuryXL
https://treasuryxl.com/wp-content/uploads/2018/07/treasuryXL-logo-300x56.png
treasuryXL2024-11-21 07:00:232024-10-31 15:22:41AI in treasury: cash forecasting and payment predictions
 https://treasuryxl.com/wp-content/uploads/2024/07/Template_BLOGS-featured-1.png
200
200
treasuryXL
https://treasuryxl.com/wp-content/uploads/2018/07/treasuryXL-logo-300x56.png
treasuryXL2024-11-20 07:00:122024-11-18 12:06:18The influence of Corporate Treasury on Working Capital
 https://treasuryxl.com/wp-content/uploads/2024/04/Kopie-van-Copy-of-Kopie-van-Template_BLOGS-featured.png
200
200
treasuryXL
https://treasuryxl.com/wp-content/uploads/2018/07/treasuryXL-logo-300x56.png
treasuryXL2024-10-30 07:00:432024-10-28 13:49:41Plans & Experiences with AI in Cash Forecasting
 https://treasuryxl.com/wp-content/uploads/2024/09/TIS-BLOGS-featured-6.png
200
200
treasuryXL
https://treasuryxl.com/wp-content/uploads/2018/07/treasuryXL-logo-300x56.png
treasuryXL2024-10-08 07:00:452024-09-30 16:56:23Unlock the Full Potential of Your TMS
 https://treasuryxl.com/wp-content/uploads/2024/09/Wout-Template_BLOGS-Expert-featured-1.png
200
200
treasuryXL
https://treasuryxl.com/wp-content/uploads/2018/07/treasuryXL-logo-300x56.png
treasuryXL2024-09-05 07:00:362025-04-24 17:16:18Growing Interest in Cashflow Management Software
 https://treasuryxl.com/wp-content/uploads/2024/08/Kopie-van-Kopie-van-Kopie-van-TIS-BLOGS-featured-4.png
200
200
treasuryXL
https://treasuryxl.com/wp-content/uploads/2018/07/treasuryXL-logo-300x56.png
treasuryXL2024-08-06 07:00:502024-08-08 12:51:04TIS Summer Magazine
 https://treasuryxl.com/wp-content/uploads/2024/07/GPS-featured.png
200
200
treasuryXL
https://treasuryxl.com/wp-content/uploads/2018/07/treasuryXL-logo-300x56.png
treasuryXL2024-07-25 10:00:332024-07-24 14:13:26Choosing the Right Financial Strategy: Intercompany Netting VS. In-House Banking
 https://treasuryxl.com/wp-content/uploads/2024/07/TIS-BLOGS-featured-5.png
200
200
treasuryXL
https://treasuryxl.com/wp-content/uploads/2018/07/treasuryXL-logo-300x56.png
treasuryXL2024-07-22 07:00:462024-07-18 13:54:18TIS Sizzlin’ Summer Webinar Series
 https://treasuryxl.com/wp-content/uploads/2024/05/TIS-BLOGS-featured-4.png
200
200
treasuryXL
https://treasuryxl.com/wp-content/uploads/2018/07/treasuryXL-logo-300x56.png
treasuryXL2024-06-03 07:00:392024-05-29 10:44:07Podcast | Bas rebel explores best practices for new treasury technology projects & Implementations
 https://treasuryxl.com/wp-content/uploads/2024/05/TIS-BLOGS-featured-3.png
200
200
treasuryXL
https://treasuryxl.com/wp-content/uploads/2018/07/treasuryXL-logo-300x56.png
treasuryXL2024-05-23 07:00:102024-05-15 10:10:57Whitepaper | The Complex World of Corporate Payments & How TIS Helps Simplify It
 https://treasuryxl.com/wp-content/uploads/2024/04/TIS-BLOGS-featured-2.png
200
200
treasuryXL
https://treasuryxl.com/wp-content/uploads/2018/07/treasuryXL-logo-300x56.png
treasuryXL2024-04-25 10:00:542024-04-22 09:51:28TIS Spring Magazine
 https://treasuryxl.com/wp-content/uploads/2024/02/Kopie-van-Kopie-van-TIS-BLOGS-featured-1.png
200
200
treasuryXL
https://treasuryxl.com/wp-content/uploads/2018/07/treasuryXL-logo-300x56.png
treasuryXL2024-04-04 07:00:352024-10-08 09:58:35Four Things Every CFO Should Know About Treasury
 https://treasuryxl.com/wp-content/uploads/2024/03/Copy-of-Kopie-van-Kopie-van-Kopie-van-TIS-BLOGS-featured.png
200
200
treasuryXL
https://treasuryxl.com/wp-content/uploads/2018/07/treasuryXL-logo-300x56.png
treasuryXL2024-03-27 09:32:552024-03-27 09:32:55TIS has Signed a Binding Agreement with Marlin Equity Partners to Secure a Majority Growth Investment
 https://treasuryxl.com/wp-content/uploads/2024/03/Grain-BLOGS-featured-1.png
200
200
treasuryXL
https://treasuryxl.com/wp-content/uploads/2018/07/treasuryXL-logo-300x56.png
treasuryXL2024-03-20 07:00:232024-07-03 11:11:45Mastering Cross-Currency Transactions Understanding FX Risks and Strategies
 https://treasuryxl.com/wp-content/uploads/2024/03/Kopie-van-Kopie-van-Kopie-van-TIS-BLOGS-featured-2.png
200
200
treasuryXL
https://treasuryxl.com/wp-content/uploads/2018/07/treasuryXL-logo-300x56.png
treasuryXL2024-03-19 09:53:192024-03-21 13:50:17A Guide to the Emergence of Instant Payments Globally & How to Navigate Them
 https://treasuryxl.com/wp-content/uploads/2024/02/Kopie-van-Kopie-van-Kopie-van-TIS-BLOGS-featured.png
200
200
treasuryXL
https://treasuryxl.com/wp-content/uploads/2018/07/treasuryXL-logo-300x56.png
treasuryXL2024-03-14 07:00:142024-03-12 13:34:59TIS Magazine | The Winter Issue
 https://treasuryxl.com/wp-content/uploads/2024/02/Kopie-van-TIS-BLOGS-featured.png
200
200
treasuryXL
https://treasuryxl.com/wp-content/uploads/2018/07/treasuryXL-logo-300x56.png
treasuryXL2024-02-12 07:00:362024-02-06 16:47:31TIS Podcast with Sugandha Singhal | Analyzing the Intracacies of Effective Treasury Management in 2024
 https://treasuryxl.com/wp-content/uploads/2024/01/TIS-BLOGS-featured-1.png
200
200
treasuryXL
https://treasuryxl.com/wp-content/uploads/2018/07/treasuryXL-logo-300x56.png
treasuryXL2024-01-31 07:00:072024-01-31 09:46:205 Ways Treasury Can Save Money & Boost Profits in 2024
 https://treasuryxl.com/wp-content/uploads/2023/12/CORPORATE-TREASURY-IN-100-WORDS_200x200-1.png
200
200
treasuryXL
https://treasuryxl.com/wp-content/uploads/2018/07/treasuryXL-logo-300x56.png
treasuryXL2024-01-16 07:00:412024-01-16 16:51:30In 100 Words | How should Treasury approach A/R Cash Forecasting?
 https://treasuryxl.com/wp-content/uploads/2023/12/TIS-100-days-3e-200.png
200
200
treasuryXL
https://treasuryxl.com/wp-content/uploads/2018/07/treasuryXL-logo-300x56.png
treasuryXL2024-01-03 07:00:582023-12-22 14:29:44Guide to Navigating a Treasurers 1st 100 Days in a New Job
 https://treasuryxl.com/wp-content/uploads/2023/12/tis-magazine-fall-200.png
200
200
treasuryXL
https://treasuryxl.com/wp-content/uploads/2018/07/treasuryXL-logo-300x56.png
treasuryXL2023-12-04 07:00:572023-12-01 08:51:43TIS Magazine | The Fall Issue
 https://treasuryxl.com/wp-content/uploads/2023/11/TIS-10-questions-200.png
200
200
treasuryXL
https://treasuryxl.com/wp-content/uploads/2018/07/treasuryXL-logo-300x56.png
treasuryXL2023-11-20 07:00:472023-11-10 11:11:0610 Common Questions & Answers About the TIS Cash Forecasting Solution
 https://treasuryxl.com/wp-content/uploads/2023/09/tis-200-2.png
200
200
treasuryXL
https://treasuryxl.com/wp-content/uploads/2018/07/treasuryXL-logo-300x56.png
treasuryXL2023-09-27 07:00:212023-09-22 09:29:41Seven Key Findings from the 2023-2024 Treasury Technology Survey
 https://treasuryxl.com/wp-content/uploads/2023/08/TIS-Magazine-Summer-Issue-2023.png
800
800
treasuryXL
https://treasuryxl.com/wp-content/uploads/2018/07/treasuryXL-logo-300x56.png
treasuryXL2023-08-29 07:00:462023-08-28 09:22:31Exploring the World of Treasury & Finance: Introducing the Debut Issue of the TIS Magazine
 https://treasuryxl.com/wp-content/uploads/2023/07/grain-interview-200-1.png
200
200
treasuryXL
https://treasuryxl.com/wp-content/uploads/2018/07/treasuryXL-logo-300x56.png
treasuryXL2023-07-27 07:00:482023-07-27 08:37:42Why Cross-Currency Management Matters: The Top 3 Risks for Businesses that Ignore It
 https://treasuryxl.com/wp-content/uploads/2023/07/TIS-APIs-200.png
200
200
treasuryXL
https://treasuryxl.com/wp-content/uploads/2018/07/treasuryXL-logo-300x56.png
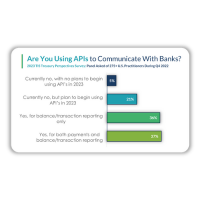
treasuryXL2023-07-20 07:00:562023-07-17 17:01:04APIs as a Game Changer for the Office of the CFO: Expectations vs Reality
 https://treasuryxl.com/wp-content/uploads/2023/07/Kopie-van-poll-results-10.png
200
200
treasuryXL
https://treasuryxl.com/wp-content/uploads/2018/07/treasuryXL-logo-300x56.png
treasuryXL2023-07-05 16:51:362023-07-12 09:23:37How far ahead do Treasurers forecast?
 https://treasuryxl.com/wp-content/uploads/2023/06/TIS-200-1.png
200
200
treasuryXL
https://treasuryxl.com/wp-content/uploads/2018/07/treasuryXL-logo-300x56.png
treasuryXL2023-07-03 07:00:092023-06-28 09:33:38Reviewing Best Practices for Treasury’s Cash Flow Forecasts
 https://treasuryxl.com/wp-content/uploads/2023/06/TIS-awards-200.png
200
200
treasuryXL
https://treasuryxl.com/wp-content/uploads/2018/07/treasuryXL-logo-300x56.png
treasuryXL2023-06-28 13:45:042023-06-28 13:49:24TIS Clients Unilever, Siemens Gamesa, and TeamViewer Win Five Treasury Technology Awards in H1 2023
 https://treasuryxl.com/wp-content/uploads/2022/07/gtreasury-200-21e.png
200
200
treasuryXL
https://treasuryxl.com/wp-content/uploads/2018/07/treasuryXL-logo-300x56.png
treasuryXL2022-07-21 07:00:172023-06-28 09:38:55Zeroing in on 4 Specific Ways Treasurers’ Can Improve Cash Forecasting
 https://treasuryxl.com/wp-content/uploads/2022/05/Een-titel-toevoegen-2.png
200
200
treasuryXL
https://treasuryxl.com/wp-content/uploads/2018/07/treasuryXL-logo-300x56.png
treasuryXL2022-06-01 07:00:122023-06-28 09:39:06Recording Live Discussion Session | More reliable cash forecasting in a fraction of the time
 https://treasuryxl.com/wp-content/uploads/2022/05/kyriba-200-19e.png
200
200
treasuryXL
https://treasuryxl.com/wp-content/uploads/2018/07/treasuryXL-logo-300x56.png
treasuryXL2022-05-19 07:00:492023-06-28 09:39:49The Role of APIs in Strategic Cash Forecasting
 https://treasuryxl.com/wp-content/uploads/2022/04/TreasuryXL_Apr28-200x200-1.jpg
200
200
treasuryXL
https://treasuryxl.com/wp-content/uploads/2018/07/treasuryXL-logo-300x56.png
treasuryXL2022-04-27 07:00:482023-06-28 09:39:27Reminder Live Discussion Session | More reliable cash forecasting in a fraction of the time
 https://treasuryxl.com/wp-content/uploads/2022/04/cashforce-200-14e-1.png
200
200
treasuryXL
https://treasuryxl.com/wp-content/uploads/2018/07/treasuryXL-logo-300x56.png
treasuryXL2022-04-14 07:00:522023-06-28 09:39:33The Treasury Dragons vs Cash Forecasting | Best-of-breed Cashforce
 https://treasuryxl.com/wp-content/uploads/2022/04/TreasuryXL_Apr28-200x200-1.jpg
200
200
treasuryXL
https://treasuryxl.com/wp-content/uploads/2018/07/treasuryXL-logo-300x56.png
treasuryXL2022-04-13 15:52:582023-06-28 09:39:38Live Discussion Session | More reliable cash forecasting in a fraction of the time
https://treasuryxl.com/wp-content/uploads/2022/04/TreasuryXL_Apr28-200x200-1.jpg
200
200
treasuryXL
https://treasuryxl.com/wp-content/uploads/2018/07/treasuryXL-logo-300x56.png
treasuryXL2022-04-13 15:52:582023-06-28 09:39:38Live Discussion Session | More reliable cash forecasting in a fraction of the timeCash Management topics
Search
Newsletter & eBook
Subscribe to our free weekly newsletter and receive your 41 pages ‘easy-to-read’ eBook, What is Treasury?
The latest treasuryXL articles
Great news! treasuryXL’s live session recordings are now available on Spotify

Go to
Partner Program
Contact us
treasuryXL
Kaldenkerkerweg 22
5913 AE Venlo
The Netherlands
Email: info @[email protected]
Telephone & WhatsApp: +31 6 2732 8942
Subscribe
Newsletter & eBook
Subscribe to our free weekly newsletter and receive your 41 pages ‘easy-to-read’ eBook, What is Treasury?


