| 7-7-2017 | François de Witte |
You might visit this site, being a treasury professional with years of experience in the field. However you could also be a student or a businessman wanting to know more details on the subject, or a reader in general, eager to learn something new. The ‘Treasury for non-treasurers’ series is for readers who want to understand what treasury is all about. Our expert François de Witte explains the cash conversion cycle and working capital managment.
Background
One of the main tasks of the treasurer is to ensure that the company has the required funds to operate. The treasurer will usually contact the banks for this funding. However, he can also finance the activities of the company by working on cash conversion cycle and the working capital management.
Cash Conversion Cycle
The cash conversion cycle (CCC) is the length of time required for a company to convert cash invested in its operations to cash collected as a result of its operations. A company’s operating cycle is the time it takes from the moment the company pays the invoices to its suppliers until cash is collected from product sales. In other words, it is the difference between when you pay for things and when you get paid. Here is a simplified example:
When you build an equipment, you need to purchase parts. Let’s assume that you pay them 25 days after the receipt of goods and of the invoice. 10 days following on the invoice for the parts, the equipment is ready to be sold. It takes another 20 days to sell the equipment to a customer. Let’s assume that the clients pay on average after 30 days. In this case, the cash conversion cycle is 35 days. Hence, the business needs to have enough “working capital” to fund this transaction until it gets paid.
The following drawing illustrates the cash conversion cycle:
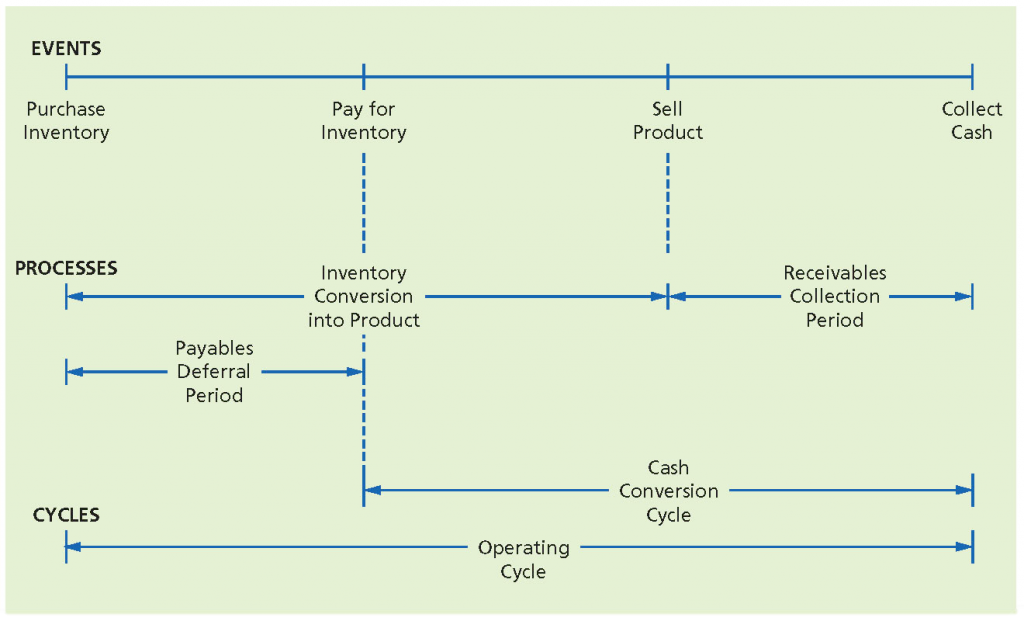
The real challenge for a company is to shorten cash conversion cycle, so as to free up cash, which can be reinvested in business or to reduce debt and interest.
If a company wishes to reduce its cash conversion cycle, and hence its working capital requirement, it can work on the following parameters:
- Order to cash cycle: this is the time it takes from the moment of the receipt of a sales order, until the moment of the effective payment of the order.
- Purchase to pay cycle: this is the time it takes from the moment that you issue a purchase order, until the effective payment of the order
- Inventory management: aiming at reducing as much as possible the inventory levels
You can reduce your Order to Cash Cycle by e.g. :
- Reducing time between delivery of goods and services, and the invoicing.
- Optimizing the collection processes, by managing the payment delays and ensuring an active monitoring of overdue invoices
- Using the right Payment instruments, e.g. by replacing cheques by direct debits
- Automation of the reconciliation
You can optimize your Purchase to Pay cycle by e.g.:
- Reducing manual and paper-based processes, duplication of data entries, reconciliation and matching processes
- Automating the processes by moving to digital documents through OCR or other techniques
- Aligning of the supplier terms and early payment discounts.
Working Capital Management Metrics
If you wish to monitor your performance in this area, it is important to have the right metrics. The most use measurement instruments for the working capital management are the following :
Days Sales Outstanding (DSO) :
This is the average number of days it takes for a company to collects its invoices. It is computed by dividing the commercial account receivables by the annual sales and multiplying this number with 365.
Example: A company with EUR 100 million turnover has end 2016 outstanding accounts receivable of EUR 15 million.
DSO = (EUR 15 million / EUR 100 million) * 365 = 54,75 days
The challenge for a company is to try to reduce the DSO as much as possible, hence shortening the cash conversion cycle. This can be done by reducing the payment terms and actively managing the overdue account receivable (credit control).
The DSO can vary from sector to sector, but as rule of thumb, when this figure exceeds 60 days, this is an alert that there is an improvement potential.
Days Inventory outstanding (DIO):
This is the average number of days of inventory a company has. I suggest to compute this by dividing the inventory by the annual sales and multiplying this number with 365.
Example: a company with 100 million turnover has end-2016 EUR 12 million in inventory.
DIO = (EUR 12 million / EUR 100 million) * 365 = 43,8 days
Here also, the aim is to keep the inventory very low. This is not always possible, because for some sectors, there can be a lengthy production process. In addition, the company needs to ensure that it has in its shops the most used products, in order to avoid losing clients. However by putting an place a good production planning and inventory management, the inventory levels can be further decreased.
Days Purchase Outstanding (DPO):
This is the average number of days it takes for a company to pay its suppliers. It is computed by dividing the commercial account payables by the annual costs of purchases (goods and external services) and multiplying this number with 365.
A company with EUR 100 million turnover, EUR 50 million of external purchases has end-2016 EUR 8 million in accounts payable.
DPO = (EUR 8 million / EUR 50 million) * 365 = 58,4 days
Traditionally, it has been recommended to try to increase the DPO much as possible, hence shortening the cash conversion cycle. This can be done by e.g. increasing the payment terms. However, when a company is cash rich or has an easy access to credits, it can be beneficial to decrease the payment terms by negotiating discounts.
The DPO will also vary from sector to sector.
Length of the Cash Conversion Cycle (CCC):
This can be computed as follows:
CCC = Days Inventory Outstanding + Days Sales Outstanding – Days Payables Outstanding.
Example:
- Average receivables collection period = 54 days
- Inventory conversion period = 43 days
- Average payable deferral period = 50 days
- CCC = 54 days + 43 days – 50 days = 47 days
Cash Conversion Cycle (CCC) in absolute amount:
I recommend to also look at the overall figure of the CCC:
CCC in absolute amount = Accounts payable + Inventory – Accounts Payable
Example :
- Accounts Receivable = EUR 15 million
- Inventory = EUR 12 million
- Accounts Payable = EUR 8 million
- CCC in absolute amount = EUR (15 MM + 12 MM – 8 MM) = EUR 19 million
Why active working capital management is important
Working capital management is a cheap source of financing, because, except in the case of early payment discounts, there is no financing cost.
The following example illustrates the gains a company can generate by improving its cash conversion cycle.
- Turnover : EUR 100 million
- Accounts receivable: EUR 15 million or 54,75 days
- Inventory : EUR 10 million or 43,8 days
- Accounts Payable : EUR 8 million or 58,4 days
- Average financing cost : 3 %
By reducing the DSO from 54,75 to 45 days, and the inventory from 43,8 to 40 days, the company can reduce its financing needs as follows:
- Accounts receivables: from EUR 15 million to 12,33 million (or EUR 2,65 million)
- Inventory: from EUR 10 million to 10,96 million (or EUR 1,04 million)
- Reduction of the CCC: from 40,15 days to 26,6 days
- Reduction in financing needs: EUR 2,65 million + 1,04 million = EUR 3,69 million
- Financing cost savings: EUR 3,69 million * 3% = EUR 110.700
Hence, when making up your financial plan, make to also focus on optimizing your cash conversion cycle, as this enables to realize easy gains. In reality this is not always easy, but it is worth the effort.
 François de Witte – Founder & Senior Consultant at FDW Consult
[button url=”https://www.treasuryxl.com/community/experts/francois-de-witte/” text=”View expert profile” size=”small” type=”primary” icon=”” external=”1″]
[separator type=”” size=”” icon=””]
 How do strategic professionals decide on the best path to success for their company? The key for strategic finance professionals and the best path to success lies in transparency and real-time reporting across company-wide cash flow and liquidity levels, bank transactions, customer and supplier relations and working capital.
 As an interim treasurer, several times when I commence a new assignment at a new client for a cash management implementation the bank selection for the cash management solution to be implemented has already been done. Not by the treasury (or any other) department, based on a request for proposal or any other selection criteria but as a result of the mandatory truck system (“verplichte winkelnering”).

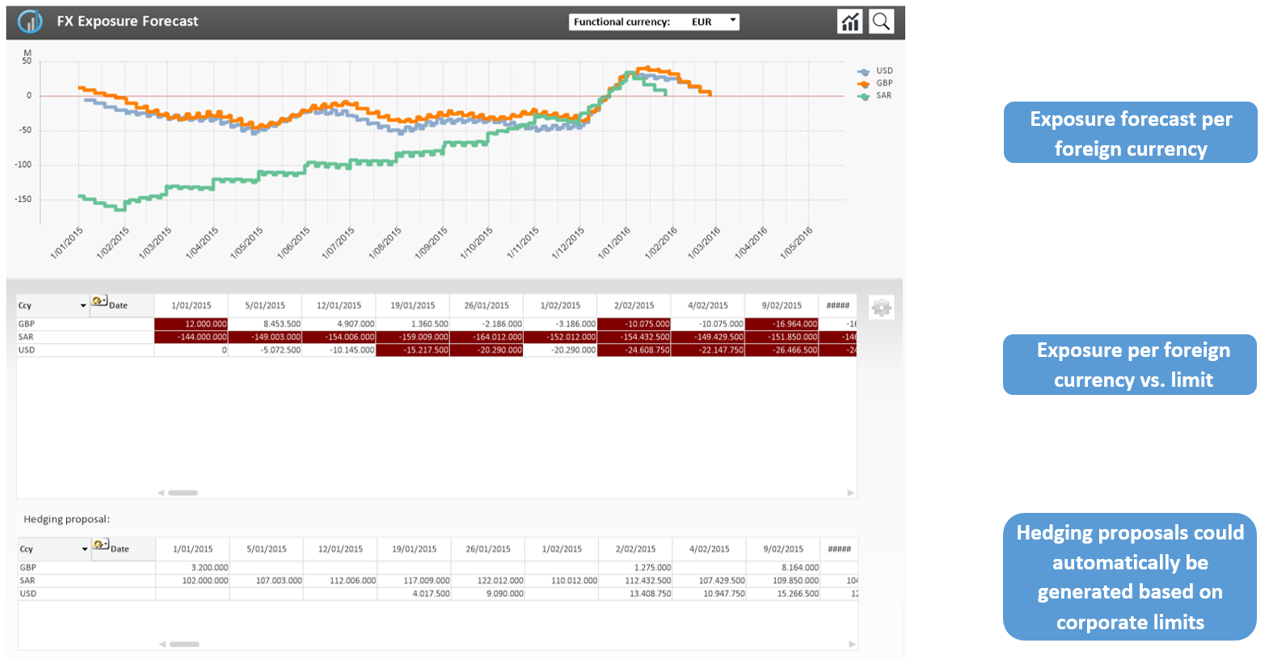
 While the role of the treasurer is changing, it becomes increasingly challenging to maintain the current workflows and simultaneously take on new demanding tasks. One of these often manual and time-consuming tasks is risk management. As seen in, among others, this year’s Global Treasury Benchmark Survey of PwC, the registration and management of financial instruments stands among the top 3 challenges on the agenda of the surveyed treasurers. In this article, we take a more in-depth look at possible optimizations in some key treasury workflows.
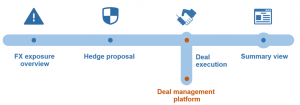

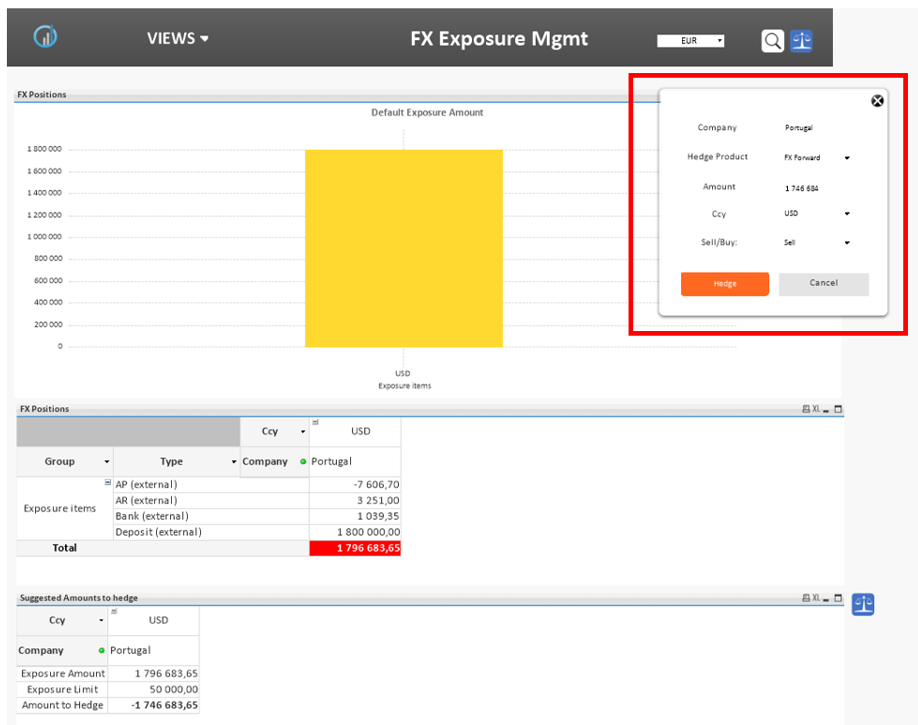
 FX Exposure Management – Future positions & exposures
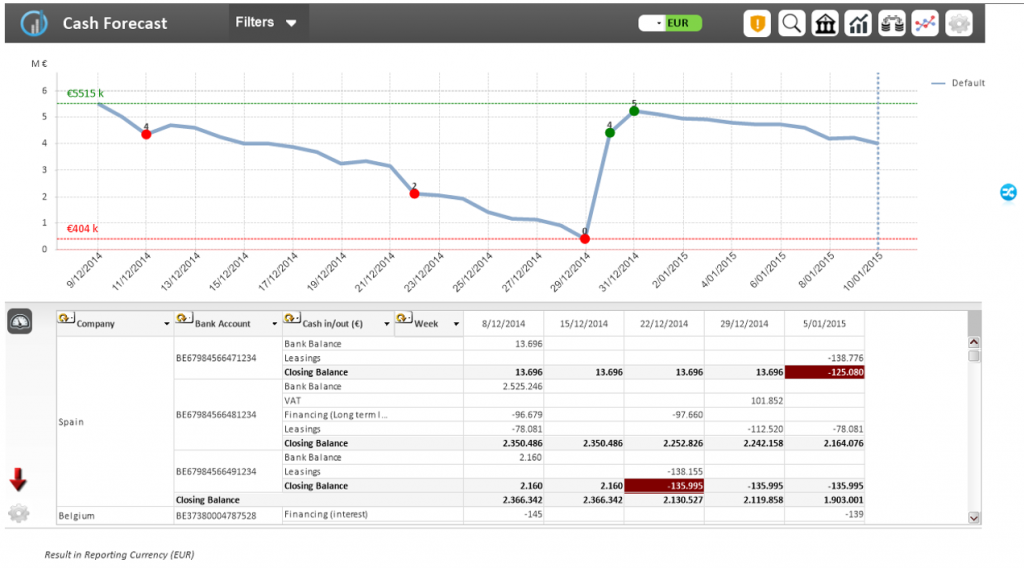


 From now on, Faber-Castell will be organising its cash flow forecasting, accounts and derivatives with TIP. Regardless of where in the world, TIP allows the many subsidiaries of the multi-national to forecast and plan without major time inputs. Data capturing is decentralised while data analysis is centralised.
 Hubert Rappold – CEO at
  E-invoicing is more than just a PDF that you send via e-mail. It’s a fully-automated process that enables receivers to get the invoice directly into their financial system. In this blog our expert Mark van de Griendt van Power toPay/Unified Post has summed up some of the key benefits for senders and receivers of electronic invoices.
 Mark van de Griendt – Cash Management Expert at