| 27-2-2017 | François de Witte |

As mentioned in my article “Treasury : proposed “to do” list for 2017”, working capital management will remain a hot topic throughout the year. The first priority is to reduce the working capital needs and financial expenses by optimizing the Order to Cash cycle. In this article, we will develop a plan of approach and propose some concrete actions enabling to generate tangible savings.
Background
The purpose of the Order to Cash optimization is to improve the whole cycle from the moment of the ordering of the goods or services, until the final payment, with the aim to:
- reduce operational inefficiencies and risks such as delays between goods or service delivery and invoicing, credit management issues, unapproved discounts and deductions, data quality issues, etc.).
- improve a number of processes such as the invoicing, the dispute management, the credit management and credit control
- assess the current the tools, build business case for the improvement thereof, and implement them.
Plan of Approach
When starting such a project, I recommend to have at first a quick scan of the overall Order to Cash process so as to identify the critical areas and to assess the business case. Based hereupon, one can then subdivide the project in a number of streams.
In such a project, typically the following processes should be covered:
Ordering processes:
It is important to have a client acceptance process (for me a must in the B2B) and a clear policy on the way orders are accepted. I recommend to only accept written orders. For nonstandard goods, we also need to examine if a prepayment is required before an order is accepted, so mitigate the risk in case that the client does not execute this obligations. It is also useful to check beforehand if the exposure on the client will not exceed the existing credit limits.
Current invoicing processes:
Ideally the sending of the invoice should coincides with the delivery of the goods or services. Furthermore it is important to have the invoices sent timely. These actions enable to reduce the “hidden DSO”. Quite a lot of companies lose several days of easy working capital by neglecting this.
A good customer database is key, and in combination with the ERP, this enables an automation of the invoicing process. I recommend to use as much as possible e-invoicing, so as to reduce the costs and the postal delays.
Current credit management processes:
A formalized credit policy is a prerequisite. A number of solution providers offer solutions for the scorings of your clients, so as enable you to define the credit limits in function hereof. In some sectors this information can be enriched by market information. Of course, one need to ensure that sales staff comply with this and check beforehand that the credit terms have been duly approved. The credit manager needs to work hand in hand with the sales staff.
Current dispute management processes:
Prevention is important. For this reason, when ordering nonstandard goods, it is recommended to check beforehand the availability of the goods and the timing of the delivery, so as to manage the expectations of your clients. Throughout the process (from the order acceptance to the delivery and the invoicing) one should apply thee “first time right” so as to avoid disputes and litigation afterwards. Check also if some services and repairs are to be done under a maintenance contract or warranty, in which case they should be invoiced to other parties.
Current collection and credit control processes
It is important to have a well-organized credit control process enabling to send reminders quite soon after the due date (if possible the first reminder after 15 days). It can help to send to send to your clients some days before a gentle reminder of the forthcoming due invoices. Once the 2nd reminder has been sent, and provided that there is no dispute, it can be useful to block the delivery of goods and services to your client, so as to have an additional leverage, and to have the credit collectors should calling the clients to see why they do not pay, and agree with them on an action plan.
When the classic reminder and call actions do not succeed, involve also the sales department and consider first a final call by another person, before sending your clients to the debt recovery service or to the debt collection agency.
It is important to also ensure an automation of the processes, in particular if one has to address high volumes. If you cannot do it with your current systems, there exist good solutions in the market.
Reconciliation and allocation of incoming payments:
This is a big challenge for many companies. Make sure that your clients use the right payment instruments and payment messages, so as to facilitate the reconciliation process. Within the accounting department, incoming payments are not always allocated promptly, distorting the real accounts receivable outstanding. As a result, reminders can be sent unduly, leading to client dissatisfaction.
KPI’s and Dashboards:
It is important to foresee KPI’s for all the involved stakeholders, as well as incentives to ensure that everybody play the game. Dashboards should enable to remain in control and to monitor regularly a number of key indicators. An area of attention are the overdue receivables. A too high percentage of overdue receivables/total portfolio might be an indicator of possible uncollectable receivables and the need for write-offs.
Attention points
An Order to Cash optimization program is complex and we need to address a number of issues such as :
- The resistance to change: people will come up with several reasons to keep on with the current processes. Overwork or client dissatisfaction will be used as excuse for deviations with the processes. Hence involve all the stakeholders, take time to listen to them and to make sure that they buy in the change. If the change is well explained, people will tend to accept the changed processes. The support of the senior management is key to address this resistance.
- The limitation of the systems such as e.g. the ERP or the accounting package: Quite a lot of companies miss opportunities because they do not understand the capacities of their ERP. Involve from the start system experts and examine with them possible workarounds.
- The standardization of processes throughout the organization : This can be an issue, in particular when working on multiple locations. Processes should be well documented. Once this is done, one can look for the automation.
- The information and training of the stakeholders: Make sure that process documentation is easily accessible, and consider organizing training sessions for the involved staff.
- The time and effort needed to implement external solutions: This requires a good business case, including all the aspects. Do not underestimate the cost, the effort and time to implement the tool.
- The determination of the KPI’s and incentives: this should not only involve finance, but also other Sales, sales administration, the production department and the other involved stakeholders. Build in incentives to ensure that everybody play the game. Make sure that the KPI’s are monitored regularly so as to be able to take corrective action in case of divergences
Conclusion
By managing better the order to Cash Cycle, you can generate a lot of savings. This requires a global approach involving all the stakeholders. To be successful, an optimization requires a number of concrete process improvements, but also the buy-in of all parties involved. A good change management should ensure that the improvements are embedded in the organization, and smart dashboards will enable to monitor that one remains on track.
Technology can help to automate the processes, but do build first a business case and to not underestimate the effort.
It can be a long journey, but in the end, it is worth the effort.

François de Witte
Senior Consultant at FDW Consult
More articles of the author:
PSD 2: A lot of opportunities but also big challenges (Part I)
PSD 2: The implementation of PSD 2: A lot of opportunities but also big challenges (Part II)
Treasury: Proposed “to do” list for 2017
Working capital management – not just a finance issue


 Our expert Carlo de Meijer is our blockchain specialist and publishes his articles on a regular basis. We present his latest article about blockchain and supply chain finance in a shorter version.
 How do strategic professionals decide on the best path to success for their company? The key is in transparency and real-time reporting. If it comes to the responsibility of the treasurer or financial professional this means deciding about company-wide cash flow and liquidity levels, bank, customer and supplier relations and working capital.
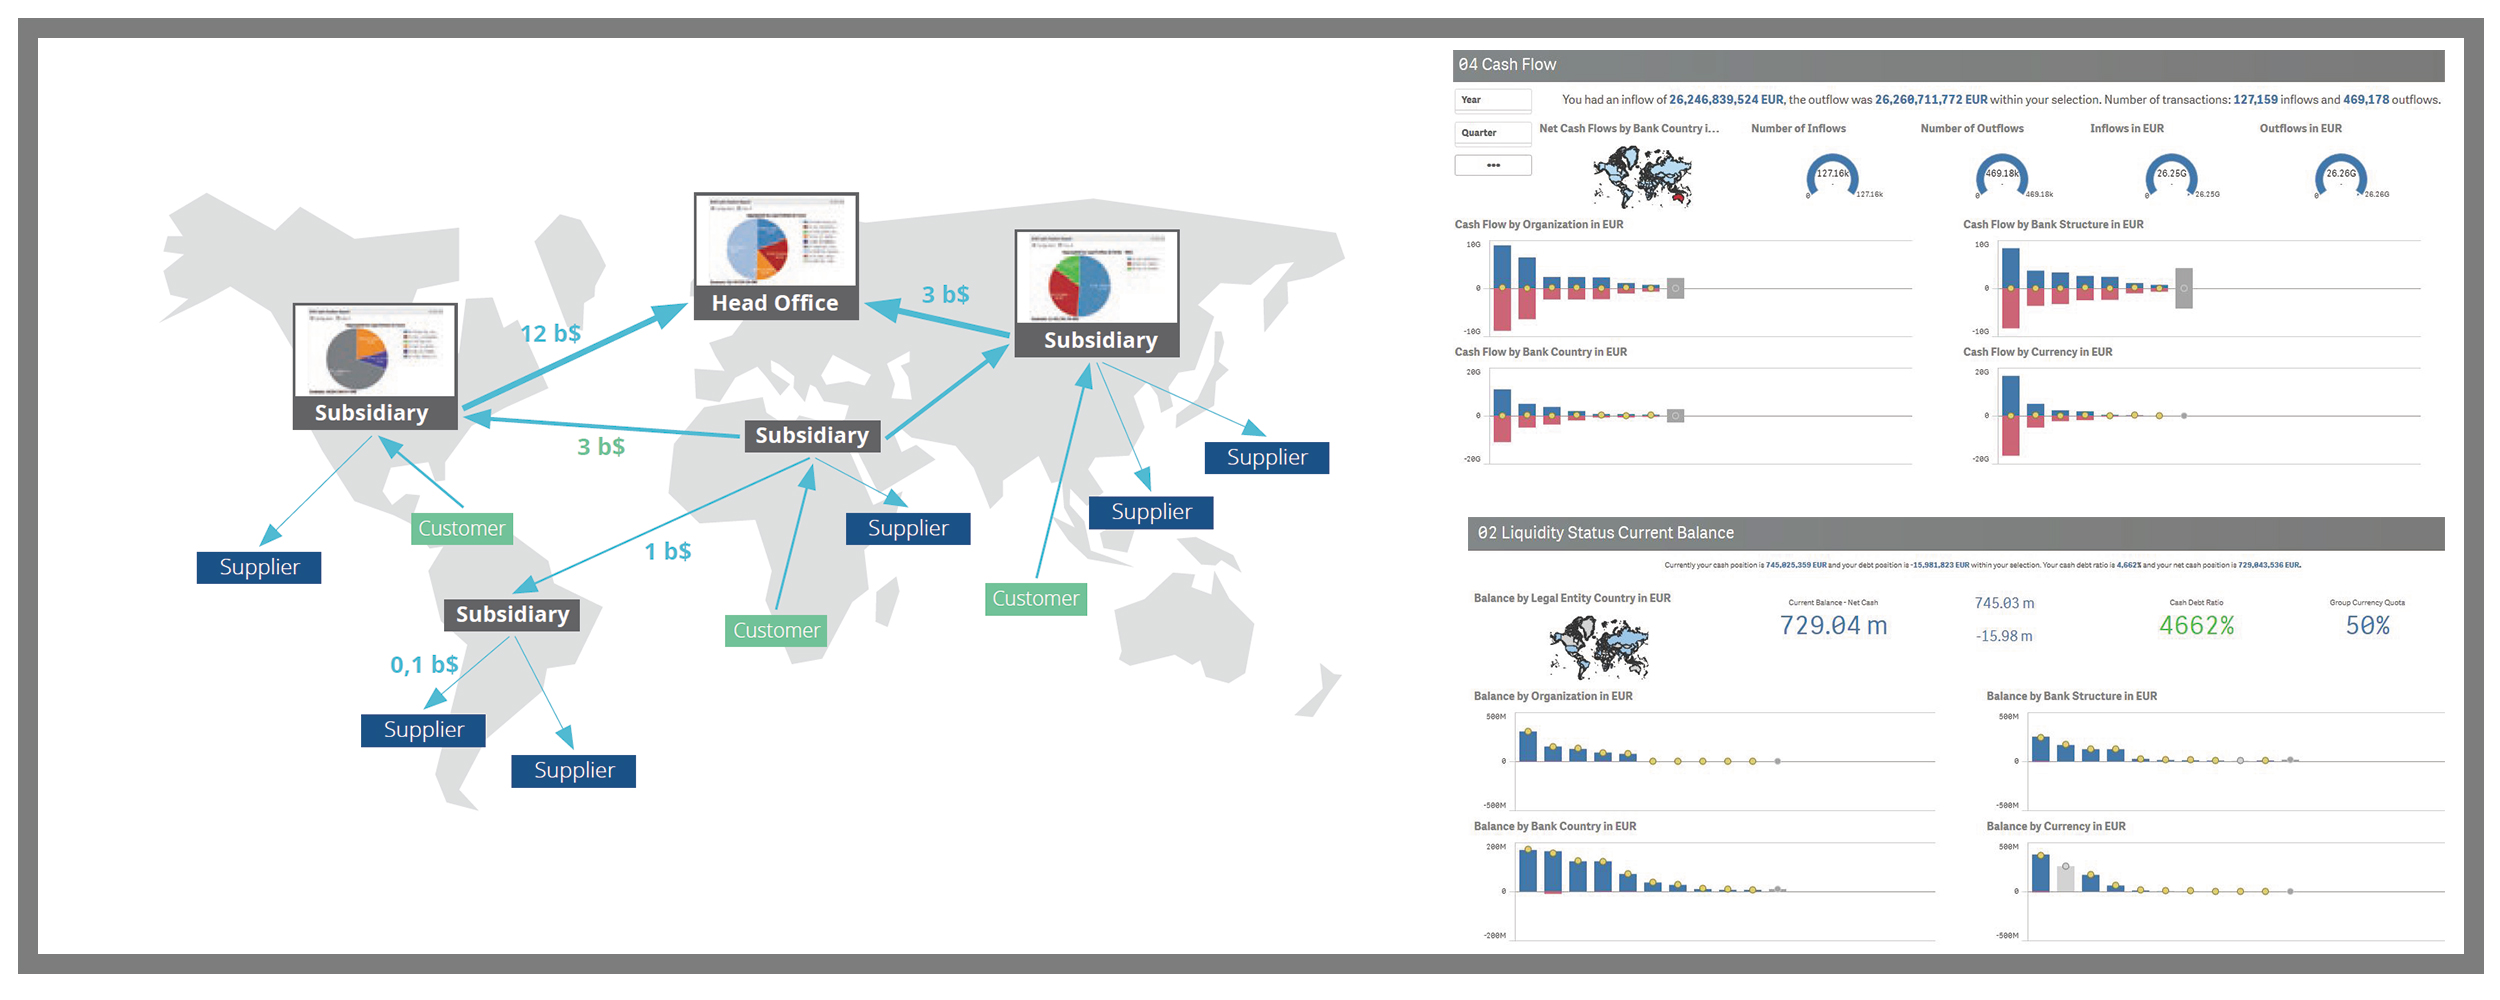

 In a perfect world, one currency is the ultimate dream for every Treasurer. The introduction of the Euro has been a major leap forward in that direction. However, current anti-euro sentiments boosted by populist movements all over Europe, seriously threaten to hamper this unique and visionary European accomplishment. This article focusses on what impact the introduction of the Euro had for the corporate treasurers and what will happen if the Euro gets skipped.
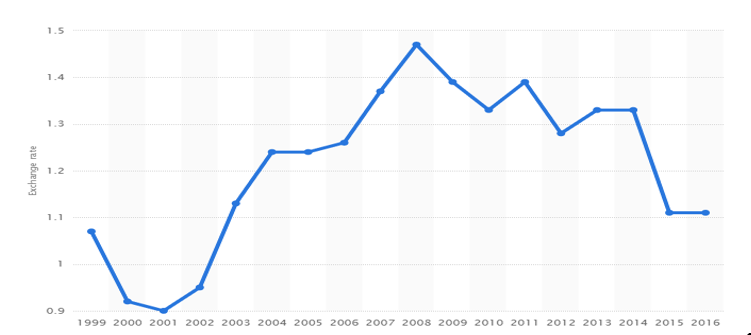

 Working Capital is the term for the operating liquidity of a company that can be used and is needed to continue the day to day business. To calculate the working capital you have to deduct the current liabilities from the current assets. By managing your account receivables, accounts payables and inventory you can fluctuate your cash position and optimize your working capital so that the cash “trapped” in the company can be lowered to a minimum while you are still able to meet your payment agreements.
 Building on the ideas shared in a