Blockchain and payments: further on the Gartner Hype cycle?
| 24-01-2018 | Carlo de Meijer |
 Payments is increasingly seen as an area that is ripe for disruption, having the potential to enhance payment processing. To overcome the current structural weaknesses in the payments area including low speed, high expenses, financial institutions are increasingly adopting the idea of blockchain or distributed ledger technology (DLT). This in order to offer (near) instant cross-border payments at lower costs, higher security and more reliability. Up till recently most of these trials have been non-interoperable stand-alone solutions. But that may change!
Last month Blockchain bank consortium R3CEV and 22 of its partners announced that they were collaborating on the development of a cross border payments platform built using distributed ledger technology. This may be the first time a shared infrastructure has been developed that addresses the full payment workforce.
The question is: where are we now in the Gartner cycle, and will this R3 initiative be the breakthrough for a more massive adoption of this technology in the payments area?
Central banks: still see hurdles
Also central banks are actively investigating and in some cases even experimenting with blockchain including those of the United States, Canada, China, U.K., France, Germany, the Netherlands, Singapore, South Africa, and Sweden. Central banks’ interest in blockchain represents further recognition of the technology’s potential to transform many aspects of financial systems worldwide, including international payments. They are generally positive about the technology’s potential for applications such as international payment solutions.
On the other hand central banks also note technical obstacles such as scalability and other concerns such as privacy, security and legal issues. They generally emphasize that the technology is still at an early stage and may be years away from widespread use for such applications.
In a recent published research paper, the Deutsche Bundesbank offers up some encouragement for DLT acceptance. They are highlighting the technology’s ability to eliminate reconciliation processes, boost transparency and protect against cyber-attacks. The Bundesbank however dampened the blockchain enthusiasm, dismissing distributed ledger technology’s prospects in retail payments, at least in the Eurozone, which already boasts fast transfers and systems that require a minimum of reconciliation and can process millions of transactions with ease every day.
The authors concede that “it is still unclear whether DLT also has the edge over today’s technology in terms of security, efficiency, costs and speed”.
Read the full article of our expert Carlo de Meijer on Finextra

Economist and researcher
 Despite interest rate being very low for the last few years, general consensus is that rates will eventually rise – rates will become more normal. Rates are being held down by the actions of central banks with their quantitative easing. As QE is scaled backed and stopped this should allow rates to rise from their current low levels. The big question is – how high will rates rise? The Euro is not yet 20 years old and that means that whilst there is a lot of data, it does not require looking through 50 or 60 years of data to try and find the norm.
 In the last year both the ECB in regard of EURIBOR and the FCA in London in regard of LIBOR have come to the same conclusion – the fixing of interest rate indices can not carry on in their present form. The current benchmarks are tainted by allegations of fraud and malpractice. Furthermore, the way that the rates are determined are also criticized – no actual transactions take place at the fixing price when the fix is made daily. But the big problem is that these fixings are intrinsically linked to financial contracts with values measured in 100 of trillions of EUR, USD, GBP etc.
 Lionel Pavey – Cash Management and Treasury Specialist
 On the 13th January 2018, PSD2 came into force. In previous articles we have discussed the meaning of this legislation. To recap – it is a directive to regulate the payment market and payment service providers, whilst also opening the market to non-banks. This should lead to a uniformity in products, technical standards and infrastructure. PSD2 will allow customers of banks to voluntarily use third party providers to process and initiate their financial transactions.

 Leningen worden vaak gezien als een goede manier om lange termijn investeringen te financieren. Een (gecommitteerde) meerjarige lening levert veelal zekerheid voor de middellange termijn. “Voor meerdere jaren vastgelegd” blijkt in de praktijk vaak niet waar te zijn. Leningen worden afgesloten als een aanvullende vorm van financieren, naast rekening courant, lease en/of andere leningen. Hoewel het aangaan van de meerjarige financiering ‘an sich’ niet heel risicovol hoeft te zijn, zijn de voorwaarden dit soms wel.
 My father was a civil engineer and would have liked one of his kids to follow in his footsteps. Regretfully for him we all went in different directions, me landing an engineering degree of the wrong type. What I did like to learn from my first business management professor was about creating bridges between various functional areas. That is what I have been doing as a recruiter for almost 25 years, the last 8 solely in corporate treasury. Why treasury?
 Having spent my working life in international finance, I have patiently listened to all the news about the Bitcoin over the last few years. During 2017 whilst the Bitcoin was on a spectacular price rise, my interest was awakened in this new phenomenon – is this the future? I attended seminars, read articles, learnt the difference between the Bitcoin and the Blockchain, searched and investigated via the web, and tried to form an opinion. These are my findings:
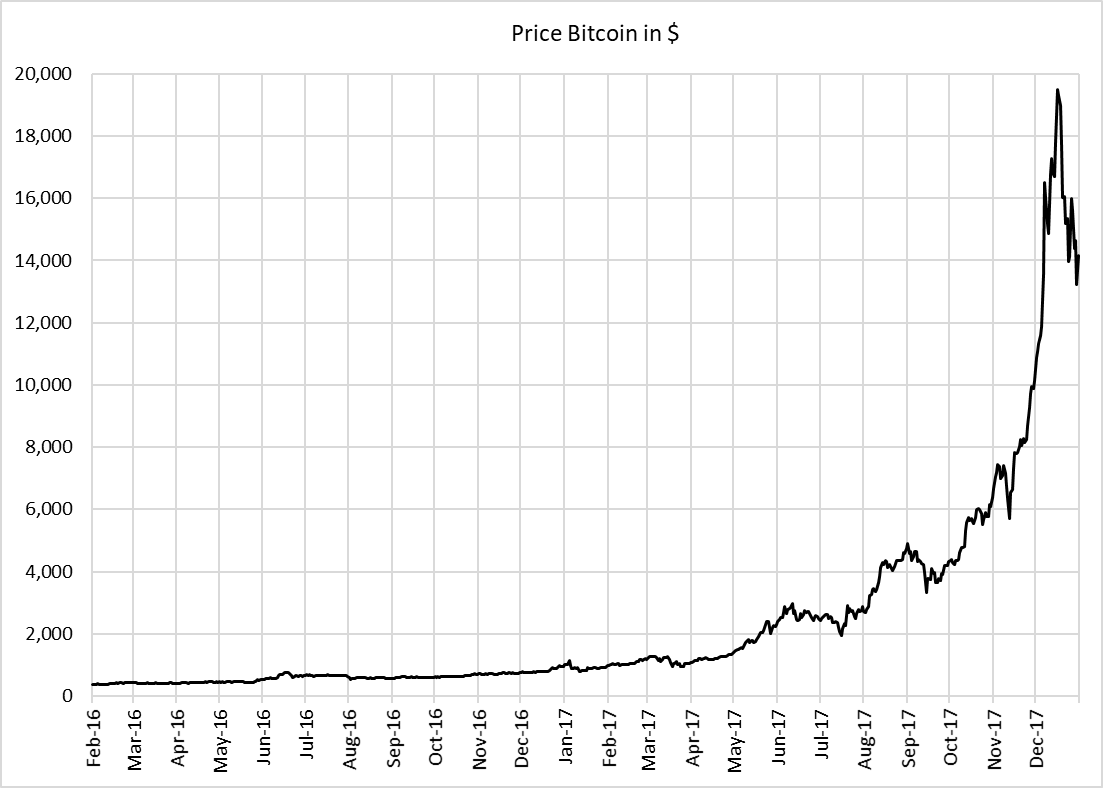 Such a stellar performance should mean that the trade volume has increased dramatically.
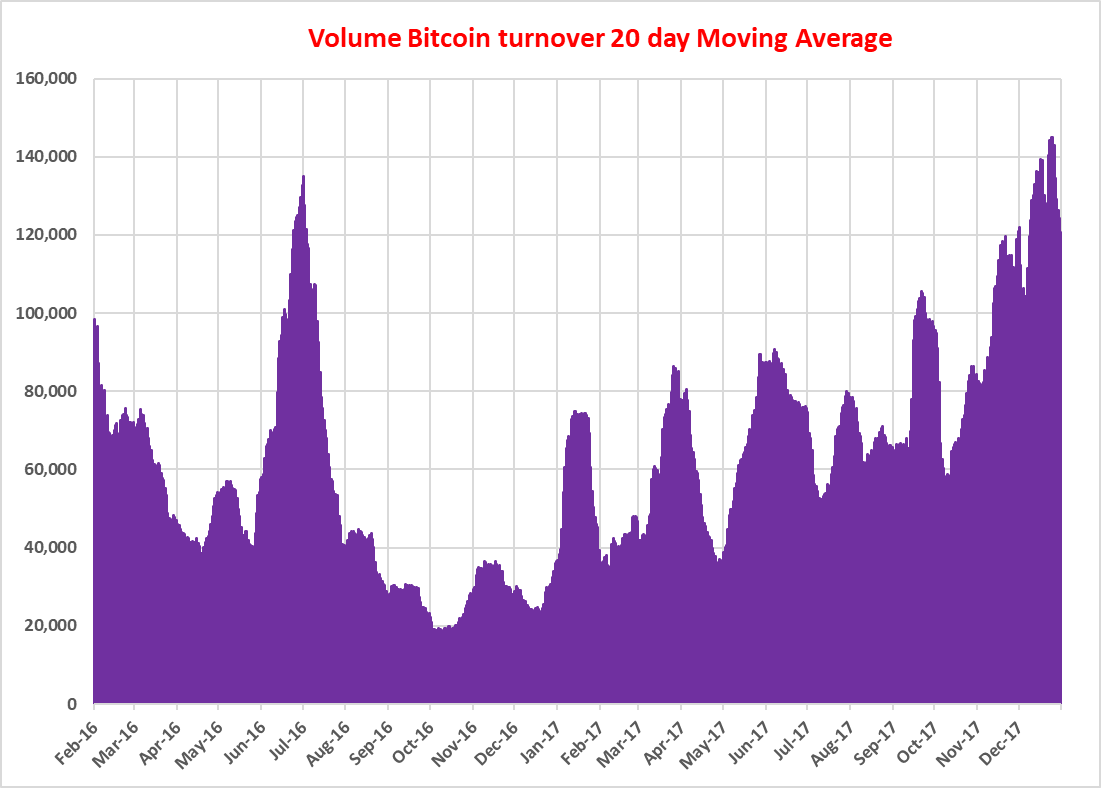 The daily volume in September 2017 when the price was about $4,000 was the same as the start of February 2016 when the price was about $400. I had to create this chart as all the data I could find related to the $ value of turnover – which was phenomenal – and not the actual number of Bitcoins traded. Normally, when an asset sees a huge increase in price, this goes together with a corresponding increase in turnover. Clearly this has not happened with Bitcoin – why?
 Money Market outlook
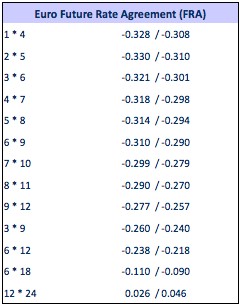
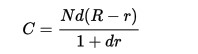 where N is the notional of the contract, R is the fixed rate, r is the published -IBOR fixing rate and d is the decimalized day count fraction over which the value start and end dates of the -IBOR rate extend.