Will the ECB taper off its Quantitative Easing programme?

| 23-10-2017 | Lionel Pavey |

On the 26th October the ECB will have their next meeting. One of the main topics will be regarding the current QE programme and a possible announcement over its extension into 2018. Currently the ECB has, after 2 ½ years of QE, purchased more than EUR 2 trillion of mainly Government bonds. At present their monthly purchases amount to roughly EUR 60 billion per month.

A poll organized by Reuters would seem to indicate that the monthly programme would be tapered down to EUR 30-50 billion per month and possibly last for another 6 to 12 months from the start of 2018. Inflation is expected to be around 1.5 per cent till at least the start of 2019 – below the ECB target of just below 2 per cent.

However, under the current rules that govern the QE progamme the upper limit on outstanding purchases is around EUR 2.5 trillion. Taking the existing monthly purchases through to the end of 2017, implies starting 2018 with a balance of at least EUR 2.2 trillion – leaving just EUR 300 billion of headroom for future purchases. If it cut monthly purchases in half, the scheme could be extend to the end of the 3rd quarter in 2018, but no further.

Can the ECB continue QE longer than expected?

The constraints imposed on QE mainly relate to the purchase of Government bonds – maximum 33 per cent of each countries outstanding debt and maximum 25 per cent of any bond issue. The provisions written into the Maastricht Treaty clearly state that the ECB may not finance member states. QE also purchases non-bank bonds (covered bonds, corporate bonds and asset backed securities) which are subject to different criteria – maximum of 70 per cent of any bond issue.
At present, the ECB only holds about 13 per cent of the eligible bonds leaving a large headroom for future possible purchases.

It is conceivable that the ECB could reduce its purchase of Government bonds and simultaneously increase its purchase of corporate bonds, thereby maintaining liquidity to its QE programme. The major drawback is that it would reduce the amount of freely tradable corporate bonds in circulation and have an effect on their price.

What does this mean for interest rates?

As long term debt instruments use Government bond yields as the basis for calculating their yield, when the ECB stops buying Government bonds, the yields on all other debt instruments will increase. At the moment the benchmark (German 10 year Government bonds) yield around 0.4 per cent per annum and the 10 year Interest Rate Swap yields around 0.9 per cent per annum. In 2014 (the year before QE started) German yields averaged 1.25 per cent even though they were in a downward trend the whole year. Assuming the yield spread between Government bonds and Interest Rate Swaps (IRS) remained constant, this implies 10 year IRS moving to at least 1.75 per cent. This would still be below the long term average since the inception of the EURO in 1999 that stands around 3.35 per cent, but a significant increase from the current level of 0.9 per cent.

What happens when the next crisis arrives?

The ECB is not the only central bank to use a form of QE. The Fed, Bank of England and Bank of Japan all have their own versions. When these countries also taper out their QE, naturally there will be a corresponding rise in interest rates. However, if a new financial crisis was suddenly to happen (not unthinkable at the moment) all 3 of these central banks can reapply QE to stimulate their economies. An additional increase to their balance sheets can be accommodated.

Unfortunately for the ECB the very criteria that now applies would make it impossible to restart QE. The ECB could not just increase its balance sheet – current criteria and regulation make that impossible. Any attempt to change the rules would be met by objections from national governments within the EU and legal action. The Bundesbank were very vocal in their objections to the implementation of QE in 2015 – those protests will not have softened by now.

This shows the constraints prevalent upon the EURO – monetary policy is the only tool that the ECB has at its disposal. One policy can not be used to fix all the problems present with the economies of all member states.


Lionel Pavey

Cash Management and Treasury Specialist


Treasurer – So what is it that you do exactly?

| 11-10-2017 | Lionel Pavey |

A few weeks ago I took my daughter Charly to the Scouts on a Saturday morning – she goes every week and really enjoys it. I get a couple of hours to myself and normally do the weekend shopping in that time. 2 ½ hours later I went back to pick her up and whilst waiting I got talking to a couple of the parents from the other Scouts, about work, whilst enjoying cups of coffee and hotdogs. They asked me what I did and I explained my vocation as a Treasurer and Cash Manager.

“Yes” one said, “so you are the same as a bookkeeper really. What makes you different? What do you bring that others do not? What makes you special?”

Advantages and benefits of Cash Management

  • Cash is King – profit is an opinion. I can not make you more profit, but I can improve your cash flows and your understanding of them.
  • I can speed up the operations your company uses to administer its cash.
  • I can help you stay solvent.
  • I can address your working capital issues.
  • I can spot fraud.
  • I can estimate your cash position for any time in the future based on your data input.
  • I can obtain better terms and conditions with debtors and creditors.
  • I can warn you when trouble will be ahead if nothing is done.
  • I can analyse the best loan deals for your financing operations.
  • I can make detailed cash flow forecasts that you can show to your banks when negotiating with them for loans or banking facilities.
  • I can reduce costs.
  • I can pay your bills more quickly.
  • I can improve your liquidity.
  • I can reduce your administrative work flows.
  • I can enable you to recycle your cash more quickly.
  • I can reduce your inventory holdings.
  • I can let you know when your future financial commitments have to take place.
  • I can help you maintain good relationships with your creditors.
  • I can optimize your cash at all times.
  • I can reduce your borrowing costs.

You need to generate enough cash from your activities to pay your suppliers, repay shareholders and/or investors and have money left over to invest and grow your business. Be honest, to do all that you need professional support and guidance allowing you to concentrate on growing your business.

They looked at me and said “So you are not really a bookkeeper then.”
I looked at them and smiled – mission accomplished!
“Now you know what a cash specialist can do for you and your company. So, give me a call when you think you need help with any of these issues.”
It is a good feeling when you positively change someone’s perception about what your job actually entails.

I told them what I can do, but did not say how. Are you interested in the how? Go to Rent a Treasurer.


Lionel Pavey


Lionel Pavey

Cash Management and Treasury Specialist


Brexit – hard or soft? What does it actually mean?

| 20-9-2017 | Lionel Pavey |

Brexit is a fact, no news here. Discussions about how this Brexit is going to look like are an ongoing topic in the newspapers. Hard Brexit or soft Brexit – what does it actually mean for the UK and the European Union? What are the consequences of a hard Brexit compared to those of a soft Brexit to all of us? It implies there are 2 paths that can be followed – actually there are 3.

3 paths

  • No deal
  • Hard – should really be called a clean Brexit
  • Soft – should really be called unclear Brexit

No deal

This is exactly as it says – if no deal is reached between both parties. UK would no longer be obliged to follow EU law and treaties. This would lead to a period of uncertainty and confusion and new treaties would need to be implemented, whilst both sides would not be receptive to each other. The EU could still try to pursue UK through international courts for monies that it felt were still owed. Highly turbulent, but could happen.

Hard

Leaving the EU by mutual consent but not actually agreeing on the future, UK would no longer have to observe the pillars of the EU that currently prevail. This includes such issues as immigration, free movement, asylum, fisheries and agriculture to name but a few. Trade would fall under WTO rules until a mutual trade policy could be drafted.

Soft

This implies links being retained between both parties, specifically towards trade. It would mean UK would gain entry to a tariff free EU market, whilst accepting free movement of people. UK would have to pay for entry, whilst being denied a vote in EU matters.

Scenarios and consequences

So, what are the chances of these scenarios and many others happening?
To answer that question we have to go back to the actual question asked at the referendum – “Should the United Kingdom remain a member of the European Union or leave the European Union?”
The wording is very important – it was not worded should we leave the EU; yes or no. This was to remove any bias in people’s comprehension as to what they were voting for. As the majority of the electorate voted to leave the EU, this makes any attempt at a soft Brexit difficult to justify against the vote of the people. Any agreement where UK pays the EU and accepts EU rule negates the referendum question.
If the referendum is negated by the actions of politicians against the will of the people, then this could lead to a crisis in the country. Flagrantly ignoring the will of the people could lead to social and political unrest.
Politicians in the UK work in Parliament, work for their party and also, very importantly, work for their constituents. A MP has to make him/herself available to answer questions from their constituents.

In the UK, voting, whilst primarily for a political party, is specifically for your local MP who represents you in Parliament. It would take a very brave (or foolhardy) politician who would ignore the will of the majority of the people. That is not to say that it could happen, just that the consequences are far reaching and difficult to predict.

The divorce settlement

The EU is demanding a sum of money from UK (currently thought to be around EUR 100 million) to settle outstanding commitments. As the 2 were never legally married, it appears an affront to demand money. UK was entitled to grant a referendum, allowing the people to decide, and no laws have been broken. The argument used by the EU that there is an agreed rolling budget for the period of 2014-2020 makes it appear that it is set in stone and can not be changed. Based on current UK contributions and the fact that they will leave in 2019, then EUR 100 million sounds excessive for the 1 remaining year of the budget.
Furthermore, if the EU wishes to pursue a divorce settlement, then UK can look at obtaining their rightful share of the assets of the EU – that also happens in a divorce. UK has been a net contributor to the EU budget for the last 40 years.

What are the consequences for all involved?

Markets will remain volatile – uncertainty will prevail at least for the next 18 months. Certain markets and countries will be badly affected – the EU fishing industry will certainly suffer if the UK exercise control over their maritime waters. Banking will be in a state of flux – will large banks leave UK and resettle in EU to have access to EU markets? Where will settlement of EUR transactions take place? German car manufacturers could be denied access to one of their top markets or face stiff tariffs to import their vehicles into UK. Will we be able to freely move and live where we want to, whilst seeking employment or claiming benefit?

The chances of forming any agreement within the next 18 months are small. There is so much that needs to be agreed upon in a relatively short time frame. If the will of the people is to be honoured, then one must draw the conclusion that the end result will be a hard Brexit.
If UK politicians choose for a Soft Brexit, then they could face the wrath of the people and a second Glorious revolution could happen, though I do not see Rutte playing the role of the Prince of Orange.
He, after all, ignored the will of the people over the Ukraine referendum…

I always try to write from an objective point of view. Being English by birth, I realize that a lot of what I have written can be perceived as subjective.I was unable to vote in this referendum but, if truth be told, I would have gladly voted to leave.
The EU has lost its way and further integration will eventually lead to fiscal union. This would result in a permanent transfer of wealth from the wealthy countries to the poorer. There would be no incentive for poorer countries to improve their economies – the rich will pay.

Lionel Pavey


Lionel Pavey

Cash Management and Treasury Specialist


More articles from this author:

The end of the Euro as we know it – When the party ends?

The treasurer and data

Managing treasury risk : Risk management (Part I) (Parts II – VII to be found on treasuryXL)

Blockchain Innovation Conference 2017- An inspiring event

Treasury for non-treasurers: Data analysis and forecasting – seeing the future by looking at the past (Part I)
(Parts II – III to be found on treasuryXL)

Building a cash flow forecast model

[separator type=”” size=”” icon=””]

Building a cash flow forecast model

| 5-9-2017 | Lionel Pavey |


No company can sort out its funding and investment requirements without having a cash flow forecast. This gives valuable insight into potential bottlenecks where there is a shortage of liquidity that needs to be addressed in order that the company can continue its day-to-day operations whilst optimizing its cash position.

2 methods

There are 2 methods to be a model – indirect and direct.

Indirect uses the balance sheet and, as such, will contain non-cash items like depreciation and bad debts. Direct uses the projected receipts and payments shown at specific moments in time.The indirect method is handy for long term forecasting beyond 1 year as it shows the money required to finance capital intensive investments and projects.

The direct method is essential for short term analysis up to 1 year as it shows the money for operational activities and working capital. As a cash flow forecast is mainly used for the direct needs of a company, it is prudent to use the direct method.

What steps need to be taken to transform a budget into a cash flow forecast via direct method?

  1. Adjust the budget to remove all non-cash items
  2. Analyse historical data to obtain seasonally adjusted cash flows for operational activities
  3. Integrate the standard payment terms for creditors and debtors and adjust the cash date
  4. If there are no clear trends within the month, spread the amount evenly over the month
  5. Where pay dates are hard – wages, taxes etc. input these into those dates
  6. Calculate the operational cash flow
  7. Incorporate expected investments
  8. Incorporate existing financing obligations (principal and interest)
  9. Never forget the BTW (VAT)!
  10. Analyse the forecast for shortfalls or periods of excess liquidity

As this is an exercise that incorporates all departments within a company, it is essential that full support is given by management to the design and implementation of the process. No one person can collect and collate all the data – this requires continuous input by controllers and treasury staff.

How to design the forecast?

  1. Establish clearly defined criteria and processes
  2. Define the role and cooperation required by all parties, whilst highlighting the benefits
  3. Ensure commitment from all parties
  4. 1 data source only – data must be presented in 1 format on agreed dates
  5. Structure – all data is delivered on time to a central point, normally the treasury
  6. Keep it simple – do not over design the model
  7. Give constant feedback to all stakeholders so that they can see how their contributions matter
  8. Question the validity of the data – is it created by a bottom-up approach or has a simple top-down approach been taken without looking at the individual components that make up the forecast
  9. Stress test the data – build simple scenarios (best and worse) whilst making simple assumptions such as debtors extending payment times, fall in sales, increase in demand etc.
  10. Never sit back and think that your task is done. This is a living model that needs to be constantly monitored and adjusted where necessary
  11. Do not punish – many people are reluctant to provide forecasts out of fear that they will be wrong. Use the model to educate and focus stakeholders onto the reality of their cash positions as opposed to their bookkeeping positions. It is all about timing
  12. Remember – if you do not have it, you can not use it. There is nothing more harmful for a company than running out of cash, regardless of what the company accounts are telling you!

If you want to know more about this topic you are welcome to contact me.

Lionel Pavey


Lionel Pavey

Cash Management and Treasury Specialist


Graphs with no time line – why and how

| 7-8-2017 | Lionel Pavey |

A key role within the Treasury function is providing forecasts to the directors and management. Graphs are a frequently used tool of course.
When constructing graphs it is normal to put time on the horizontal x axis and read the prices from left to right – from old to new. Visually, this appeals to us as we normally read from left to right. However, when the price does not change much for a long period of time the graph no longer looks fluid – there is a period of activity, followed by a long period of almost standing still, followed by another period of activity. To try and eliminate this period of inactivity whilst still presenting the data requires an approach where sequential time is removed from the equation. This brings us to the last article in this series.

The following two graphs ignore time and focus purely on changes in the price that have been filtered to meet specific criteria.

Renko Charts


Prices are represented by blocks – hollow for upward movements and solid for price falls.

Every block has a predefined value – if we were showing interest rates a block could represent 5 basis points. If we had an upward price movement this means that the following upward block can only been drawn once prices have risen more than 5 basis points from the last block. If the price moved up 4 basis points and then dropped by 3 basis points, no additional blocks would be added to the graph.

Blocks are plotted at a 45 degree angle showing upward and downward sloping price changes.
Price reversals are shown when prices have moved more than 2 blocks in the opposite direction. Yet again if we had an upward slope and the price was 1.25 (our blocks are set to 0.05 or 5 basis points) we would require a downward movement of more than 0.15 (15 basis points) to 1.10 to draw 2 solid blocks downwards.

What remains is a very smooth representation of price movements with a uniform value for every block, whilst filtering out smaller movements that have been filtered out by the conditions set on block size.

Point and Figure Charts

Price changes are represented by vertical columns – X’s for rising prices and O’s for falling prices.
As with Renko charts, the X’s and O’s have a predetermined size and a price reversal is shown when prices change by 3 boxes as opposed to 2 on a normal Renko chart. When direction changes a new column is drawn to the right of the present column. Otherwise, the same criteria is applied to both charts except point and figure show true vertical columns as opposed to 45 degree lines.

So why would someone look at prices in this particular way? Such a chart does not necessarily show the latest price – the predefined filters ensure that only price changes that meet the criteria are shown.

The main advantages include:

  • A constant filter that reduces the noise associated with normal time charts
  • Analysis is based only on movement – not on time
  • Perceived support and resistance levels are easier to see
  • The current trend is very clear to see

All the techniques shown in this series are applicable to everyday analysis and everyone has their favourite approach. Some like to see all data, whilst others prefer to see filtered, smoother data. The eternal question when looking at charts and seeing the current trend is to ask “where will the price go?” Initially, the immediate answer is that price will follow the current trend until such time as it does not anymore. This might seem a cheap flippant answer, but it is the truth. We have firmly established that we need to know the price in the past to determine if the present price movement is in a clearly established trend. If we knew nothing about the price in the past it would be pure guesswork to say which way the price would go?

We could still be wrong however, but at least we can establish why and how we made our opinion.

No chart or charting system can clearly determine what the future price will be with 100 per cent accuracy. By following the trend we can at least say what the current market direction is, without being able to clarify, purely on price, when the market will change direction.

Charts that eliminate time make it easier to see where the top and bottom of the market prices have been established. Therefore, if we are in an upward trend and approaching a market high that has been reached twice before, we can state with a reasonable amount of confidence that we are approaching a level that the market has tested twice before but not been able to break above. This would imply, on a technical analysis, that there is perceived resistance in the market to taking the price above the previous high.

However, a word of caution when using charts.
The best analogy I have ever heard for not relying 100 per cent on charts is as follows:

Would you sit behind the steering wheel of a vehicle and drive forward whilst the windscreen was blacked out and only have the rear view mirror to show you where you have been and only have that information to decide when you had to steer?

There is no system that can guarantee telling you what the future price will be. Analysis has to be taken with a pinch of salt but, any market professional should be able to perform analysis. If you can not analyse then you can not predict.

Lionel Pavey


Lionel Pavey

Cash Management and Treasury Specialist


You might have missed the first two articles of this series and can find them here:

Treasury for non-treasurers: Data analysis and forecasting – seeing the future by looking at the past (Part I)

Treasury for non-treasurers: Data analysis and forecasting – Seeing the future by looking at the past (Part II)


Moving Averages – how to calculate them

| 1-8-2017 | Lionel Pavey |


In the second article in this series we will be looking at different types of moving averages. Moving averages are used to determine the current trend of a price. They filter out the extremes within a range of data and present a smoother picture. They are almost exclusively calculated using the arithmetic mean. Some studies have been done using the median, though no advantages have been discovered. The following 3 methods are the most common approaches. In all following examples we shall assume an average calculated over a continuous series of 10 data points.

Simple Moving Average (SMA)

We take 10 consecutive values and calculate the simple arithmetic mean. When we calculate the next value we drop the oldest value in the series and add the newest value. We are constantly using the most current data in our calculation. Every data point receives the same weighting i.e. 10 per cent of the complete series. Whilst being very easy to calculate criticism is levelled at the fact that all data points receive the same weighting. This can distort the average when the market is volatile – more recent data is closer to the true market price.

Weighted Moving Average (WMA)

Here the 10 data points are assigned different weights, usually based on a simple mathematical progression. The 10th data point (most recent data) would be multiplied by 10; the 9th data point (second most recent data) would be multiplied by 9; etc. The product of these calculations would then be divided by 55 to produce a weighted average. This weighted average applies more importance on the most recent prices and, therefore, more closely match the current price.

Exponential Moving Average (EMA)

This is another form of a weighted average, but the weighting factors decrease exponentially. As such, whilst the older data points decrease exponentially in value, they never stop. Therefore, this average encompasses considerably more data than the previous 2 examples whilst still being an average calculated with only 10 data points.

The results

EMA is more responsive than SMA. An EMA graph will accelerate faster, turn quicker and fall faster than a SMA graph. This is due to the weighting given to the most recent data. However, these are all lagging indicators – they will always be behind the price. Furthermore, if a market is trapped in a very small trading range the averages will not be as smooth as the actual data. One of the main goals of using averages is to see if prices break out of a range and start a new trend.

Moving averages can be used simply to see what the current trend is. They can be further used by applying different 2 moving averages (one for 10 days and another for 50 days) to ascertain the change in momentum by 2 different time lines. But they all lag the market data.

Most of the time prices will tend to concentrate in a small area, with occasional larger movements up or down establishing the next area of consolidation. Is there an alternative way to design moving averages that take this into consideration?

Adaptive Moving Average (AMA)

Instead of just weighting the data, AMA also look at the price volatility. When prices are in a small range AMA will notice this lack of volatility and provide a trendline that is almost flat. As prices break out of the range AMA will move quickly up or down, depending on the change in prices. The advantages of AMA are that, visually, when prices are reasonably flat (little volatility) a clear flat line is shown so that even if the actual market price is lower than the AMA, it is clear that it is still within a range. As AMA is more sensitive to volatility, it can contain more data about the current trend. An initial breakout from a tight range will result in a very steep line for AMA. The trend can continue, but AMA will clearly show earlier than other averages when the trend is weakening. The only basic problem with AMA is the calculation – it is far more complex to calculate and is not so intuitive when you come to explain it to someone who does not know it.

As stated earlier, all moving averages suffer from lag – they are behind the actual price curve. Our last example is an average that attempts to remove this lag, whilst being more reactive to the current price.

Hull Moving Average (HMA)

Initially, a WMA is taken for 10 data points. Then a WMA is taken for half this period (5 data points) and is calculated with the 5 newest data points. The difference between these 2 is then combined with the WMA for the shorter period to arrive at a new average – the HMA.

The HMA is faster, smoother and eliminates most of the lag that is present in the other moving averages. In fact, it most closely resembles the actual market data.

All these averages are used to attempt to show what the trend is in the actual price, whilst filtering out the noise from all the prices, and presenting the data in a smooth form. Yet again, as previously mentioned, a change in the underlying fundamentals of the price will always have more impact on the price than any form of technical analysis.

However, if we concede that for a large majority of time prices are just trending, a moving average can be used to try and predict when the prices have moved out of their range and are on a new path with fresh momentum until that slows down and the following range is established.

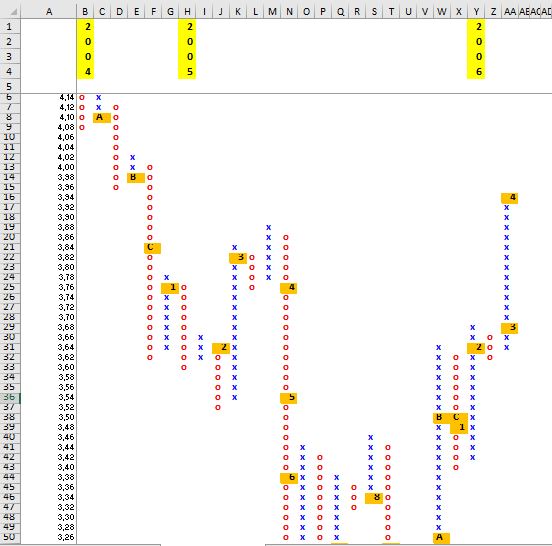
When charting data we need to appreciate the amount of data we will be producing. Even if we just use the price at the start of the day, or the end of the day, we will accumulate at least 255 data points every year. If prices are in a small range, then more data is added to the chart series to provide a more dynamic picture. But this can make the visual data more cluttered once we include the actual data and 1 or 2 moving averages. Would it not be better if we could eliminate time and just look at price?

Read also my first article in this series where I tell you more about several types of forecasts.

In the last article in this series I will look at 2 common methods of showing price data devoid of timelines.

Lionel Pavey


Lionel Pavey

Cash Management and Treasury Specialist


Forecasting the future by looking at the past

| 25-7-2017 | Lionel Pavey |


A key role within the Treasury function is providing forecasts to the directors and management. The most obvious would be the cash flow forecast, but others would include foreign exchange prices, interest rates, commodities and energy.

A forecasts is a tool that helps with planning for the uncertainty in the future, by analyzing data from the past and present whilst attempting to ascertain the future.

Internal – cash flow forecast

We would like our forecasts to be as accurate as possible – that the values we predict are close to the actual values in the future. This requires designing a comprehensive matrix to determine the variables needed for the data input. Data has to be provided by all departments within a company to enable us to build a forecast. This data needs to be presented in the same way by all contributors so that there is consistency throughout.

We also have to see if the forecast data is within the parameters of the agreed budget. We also need to check for variances – why is there a difference and how can it be explained.

External – FX and Interest Rates

A more common approach is to read through the research provided by banks and data suppliers to try and see what the market thinks the future price will be. Also we need to include data from the past – we need to know where the price has been, where it is now and what the expectation is for the future.

Extrapolating forward prices is notoriously difficult – if it were simple, we would all be rich in the future! But, by including past data, we can see what the price range has been, both on a long term as well as a short term basis.

When attempting to find a future value there are 2 common methods used – fundamental and technical.

Fundamental Analysis

Use is made of economic and financial factors both macroeconomic (the economy, the industrial sector) and microeconomic (the financial health of the relevant company, the performance of the management). The financial statements of a company are analysed in an attempt to arrive at a fair value. This leads to an intrinsic value, which is not always the same as the current value.

The value is normally calculated by discounting future cash flow projections within the company.

Technical Analysis

Use is made of the supply and demand within the market as a whole and attempts to determine the future value by predicting what the trend in the price should be. This is done by using charts to identify trends and patterns within the data. This assumes that the market price now is always correct, that prices move in determinable trends and that history repeats itself. Technical analysis uses the trend – this is the direction that the market is heading towards.

Whilst these 2 approaches are independent of each other, they can be used together. You could take a fundamental approach to value a company or asset, and then use technical analysis to try and determine when you should enter and exit the market.

Fundamental analysis is more of a long term path and technical analysis is more short term. The most important thing to remember is that markets only really experience large movements based on changes to the fundamentals. Predicting the long term future only via technical analysis is likely to be incorrect. All the major movements over the last 50 years in the prices of shares, bonds, foreign exchange and interest rates have occurred because of a change in the fundamentals.

In the next article, I will look at various methods of calculating averages to determine the trend.

An economist is an expert who will know tomorrow why the things he predicted yesterday didn’t happen today.

Lionel Pavey


Lionel Pavey

Cash Management and Treasury Specialist


Blockchain innovation conference 2017- an inspiring event

| 26-6-2017 | Lionel Pavey |


I had the distinct pleasure of attending this conference in an editorial role for TreasuryXL.
More than 50 speakers and 400 attendees ensured that there were many lively discussions and thought provoking statements made during the day.

So, what is Blockchain?

We keep reading about it, and I have a basic understanding of the concept, but this day enabled me to discover more. It is a distributed ledger, or even more simply put – a database; but a database with additional properties.
General characteristics include that they are independent, secure via encryption, either public or private, permanent, trusted, shared and decentralized.

What can Blockchain do?

As stated recently by Carlo de Meijer – another expert contributor to TreasuryXL – beyond the obvious applications relating to banking (payments and settlements), potential non-financial applications include intellectual property, health records, contracts, tax collection, voting etc.

What are the advantages of Blockchain?

  • Single source of truth – all data centralized and shared
  • Assets can be digitized
  • Transactions and data are secured via cryptography
  • Triple entry accounting – you, your counterparty and the Blockchain
  • Confirmation is at the ledger level
  • Third parties are known and trusted
  • Simplify processes
  • An imbedded KYC platform
  • Trust is organized at the transaction level and not the company level
  • Being able to focus on core competencies
  • Settlement can be against a utility or service and not a currency
  • Transparent and traceable
  • Reduction in fraud
  • Bespoke smart contracts
  • It is data-driven

What are the problems with Blockchain?

  • Cryptocurrency is small and pricing is volatile
  • Market is still immature
  • Has to be scalable to make it cost effective
  • Platforms must be sturdy and resilient
  • Proof and security of identity are major issues
  • A steep learning curve for all new entrants
  • Unknown platforms in the future – current providers may not exist in the future
  • Misunderstanding the purpose of the Blockchain – clients want solutions , not just Blockchain

Soundbites

  • True acceptance will only happen when a cryptocurrency is backed by Government/Central bank
  • Implications – overestimating in the short term; underestimating in the long term
  • Education needs to prepare for the social consequences and changes for the next generation
  • About 100 people own about 50% of all the Bitcoins that have been mined so far
  • Bitcoin is undervalued – in 10 years time it could be worth $500k – $1m per coin

Business topics

  • Financial institutions highlighted the need for validation and simple processes, along with being able to manage, track and protect trade transactions.
  • A good example of the application of Blockchain in banking was shown on an export/import case where much time was won by the use of shared documentation.
  • A practical application was shown relating to PGB (personal health budget). Clarity was created for the patient (budget holder), local authority, budget authority and the local care worker.
  • An example of managing contracts for real estate.
  • A French institute that collects data on sleeping patterns, to allow for better diagnosis.
  • A Chinese lending institute that assists in the financing of smaller entities within the supply chain.
  • Various discussions on the concept of “Pay per Use” and the “Sharing Economy”.

Highlight

A simple question was asked – “Do you want to participate with us in a better future?

This was the start of a very inspirational talk given by Jan Peter Doomernik from Enexis BV. After such a simple eloquent question, I was confronted by a slide entitled “Disruptive infrastructures towards basic income”.

Despite my initial frustration at what I felt was an awkward title after such an uncomplicated question, I was intrigued how the 2 would come together. What followed over the following 20 minutes, was an insightful and visionary talk that showed how the world of the future could look like via autonomous assets creating basic income for people.

The link to the conference video can be found at https://blockchaininnovationconference.com/live/ and the film starts at 9:19:00

A shorter version of the slide show can be found at https://www.youtube.com/channel/UCZ_HUFBqz1fEgwNRXRZZbXg

I found the presentation to be engaging, challenging, compelling and provocative. The integrity and simplicity in his story were thought provoking and proof, if needed, that technology can change our lives in a very profound way. The beauty of it all was that solutions were proposed without being pushed into the background by monetary issues.

So what have I learnt?

Conferences should be organized via smart contracts on the Blockchain – they never stay within the agreed timeframe.

From a practical point of view, after having seen the presentations on trade finance, I started thinking about how could one financial solution be developed for all participants in a supply chain as opposed to every individual party having to arrange their own cost of funding due to the time lag between sale and settlement? I am sure there are already people working on that solution.

Blockchain is here to stay – it might get a different name and come with a different set of clothes on it but, essentially, it is here to stay. We will all have to learn to embrace it – our tried and tested concepts will change.

They say the future is bright – but with Blockchain and Bitcoin we will have to go mining. Now that is normally in the dark and below ground. A paradox!

Lionel Pavey


Lionel Pavey

Cash Management and Treasury Specialist


Payment threat trends

| 12-6-2017 | Lionel Pavey |

In the article ‘payment threat trends’ on FinExtra.com you can read that the European Payments Council provides an insight into the latest developments on threats affecting payments, including cybercrime. You can also download the document, which is divided in two sections. One analyses threats including denial of service attacks, social engineering and phishing, malware, mobile related attacks, card related fraud, botnets, etc… Another section aims to include early warnings on threats related to emerging technologies which could lead to potential fraud, including cloud services and big data, internet of things and virtual currencies.

Payment policies

Generally, companies will have a secure, written policy for making payments. These will be generated from the purchasing and bookkeeping systems and should be reconciled. Beneficiary static data should be restricted to view only for the staff – only authorized staff can make and amend the data.
Payments relating to creditors should only be processed if a purchase order has been originated internally and is approved. All payments should be uploaded to recognized bank systems and verified with a six-eyes doctrine.

The biggest area of concern relates to electronic payments outside of the abovementioned process – namely via credit cards. If inventory levels are not correctly monitored then it can occur that a one-off purchase order is made. Payment should be made through a recognized payment provider such as Ideal or PayPal. Furthermore, the issuing of credit cards to key personnel leads to many more risks that can not be directly controlled by the company.

Risks for companies

When using a credit card in a public area, there are a few obvious dangers:

  • Card being stolen
  • Open WIFI in the area
  • Skimmers applied to hand held card devices

Up to now, the majority of payments have occurred on stand-alone bank software. As we enter the electronic age of disintermediation, there are many companies offering payment services. Blockchain and bitcoin are the obvious examples. No system is completely secure but, in the past, banks have made good on any loses if it was shown that the banks systems were at fault. However, hacking into Blockchain wallets and taking electronic coins has occurred and the losses are not covered as they are not run by banks or governments.

For a company this leads to direct risks such as monetary loss, fraud and loss of reputation. Also of concern is the danger of company data being stored by external third parties.

Clearly defined doctrine

Despite all the technological advances being made that make payments easier, companies need to stick to a strong clearly defined doctrine for payments:-

  • Only payments via purchasing and bookkeeping systems
  • Restricted use of credit cards
  • Elimination of petty cash
  • Secure protection of the static data relating to creditors
  • Payments offered only through recognized bank software

Blockchain

Blockchain is a reality – its uses go far further than just payments. The technology can not be stopped – the major issues (in my opinion) revolve around the electronic currencies (Bitcoin).
Companies would do well to investigate the advantages that Blockchain offers and consider how it can be implemented within a company. Some of the potential uses include compliance, insurance, finance, energy, supply chain management, human resources, accounting, data, taxes etc.

As for payment threats – stay alert, identify and manage risks, and keep abreast of changes.

Lionel Pavey


Lionel Pavey

Cash Management and Treasury Specialist


Safety of payments

Payment fraud – Leoni case

The end of the Euro as we know it – when the party ends?

| 4-5-2017 | Lionel Pavey |


The papers are full of stories about the level of Government debt within the Eurozone (Italy has a debt to GDP ratio of more than 130%), probable new bailouts for Greece, lack of suitable bonds to purchase for Quantitive Easing, Brexit, the rise of populist rightwing politics etc. Well at least we have all the bad news out in the open – don’t we?

Target 2

A new problem has arisen that was partly accelerated by QE – namely the outstanding national balances within Target 2. This is the “Trans European Automated Real-time Settlement Express Transfer System” foe the Eurozone. The key word is “Settlement” as I shall explain.
When a financial transaction is agreed 2 actions have to happen – clearing and settlement. Clearing entails all the actions that must be undertaken up to settlement, such as delivery of bonds, securities or shares. Settlement means the exchange (transfer) of money for goods or bonds etc.

When a party in Italy buys goods from the Netherlands, they instruct their bank to debit their account and credit the account of the seller. This is a cross-border transaction. But, within the Eurozone monetary settlement does immediately take place between banks. The Italian bank will have its balance reduced at the Banca D’Italia and the Dutch bank will have its balance credited at de Nederlandsche Bank. However, the balance is not settled between the 2 central banks – a new claim is shown on their books.

At the end of 2016, according to the Euro statistics website Italy has a negative Target 2 balance of EUR 420 billion with other countries in the Eurozone. This amount has been accumulated over the years since 1999 and now represents more than 25% of GDP. This is on top of the Italian Government debt of 130% of GDP. If a country were to leave the Eurozone they would be liable to immediately settle their Target 2 balances – something that is not realistic. Under the current agreement the other countries within the Eurozone would be liable to cover the debt. Target 2 balances do not have to be settled as countries would never default appears to be the thinking.

At the other end of the scale, Germany has an outstanding claim on other Eurozone countries of EUR 830 billion. At the moment these amounts are shown at full face value in the books – it would appear that politically, no one wants to acknowledge that the claims can not be settled in full under the current constraints within the Eurozone. If the Eurozone are 100% committed to supporting the Euro and, the balances are not going to be settled within the foreseeable future then, eventually, something will have to break.

Emperor with no clothes

Confession time – I am English (and proud of it). If I had been able to vote in last year’s referendum in the UK, then I would also have voted for Brexit. This does not make me anti-European; rather the reality of the Eurozone is very much like the fable of the Emperor with no clothes. Everyone sees it, but no one will say it. Perhaps, a solution can be found that does not mean debt forgiveness, writedowns, defaults or exits, but common sense would imply that this is wishful thinking.

When I was a young boy at Grammar School I had to learn some poetry for my English Literature exam – it included D.H. Lawrence. As a wild youth I could cope with Shakespeare, had a hard time with Chaucer, but fell in love with a poem by Lawrence entitled “A Sane Revolution”. He told us to make a revolution for fun and not in seriousness. Also I knew the poem as it was quoted by Mott the Hoople who got me through my teenage years with their music.

The creation of the Euro is a revolution in European history, but could it ever be called sane?

TARGET 2 BALANCES

Source: http://sdw.ecb.europa.eu/reports.do?node=1000004859


GOVERNMENT DEBT

Source: http://www.debtclocks.eu/select-an-eu-member-state.html

Lionel Pavey


Lionel Pavey

Cash Management and Treasury Specialist