Verzekering maximale Euribor rente
| 30-09-2016 | Erna Erkens |
 U kunt de zekerheid kopen dat u over uw variabele financiering nooit een hoger 1- maands Euribor tarief betaalt dan 0.25% (exclusief de opslag uiteraard). U blijft gewoon het 1 maands Euribor betalen zolang dit onder het 1 maands Euribor onder de 0.25% blijft.
Heeft u een financiering bij een bank met een variabele, bijvoorbeeld 1 maands Euribor rente?
Dan denk ik dat het een goed idee is om een renteplafond (Rentecap) te kopen op deze Euribor rente. Ik heb de afgelopen tijd een aantal artikelen gelezen en hoe meer ik er over nadenk, hoe sterker mijn overtuiging wordt dat de rente sneller zal stijgen dan de markt nu in prijst. Dit is te zien in de platte rentecurve.
Dit is een grafiek van korte naar de lange rente. We bevinden ons, volgens mij, in een ongezonde rente situatie. De rente is historisch laag en er gebeurt niet wat de ECB hoopte dat er zou gebeuren. Namelijk inflatie en economisch herstel (dit is er dan wel mondjesmaat maar met veel bijwerkingen).
De negatieve effecten wegen volgens steeds meer mensen niet meer op tegen de positieve effecten. Er komen steeds meer meningen en overtuigingen dat dit zo niet door kan gaan en het borrelt. Misschien nu nog diep onder de grond, maar noem het vrouwelijke intuïtie, dit gaat volgens mij sneller veranderen dan waar de markt nu rekening mee houdt. Leest u Joseph Stiglitz en Bas Jacobs er maar eens op na. Stel dat Donald Trump president wordt op 8 november. Dan gaat de rente echt snel stijgen want hij is niet vies van verhoging van de overheidsuitgaven. En dat kost geld!
De korte (Euribor rente) en de lange bijvoorbeeld 5 en 10 jaars rente zijn heel laag. Daarom is de premie op voor het kopen van een renteplafond op het Euribor (1 of 3 maands bijvoorbeeld) nu relatief heel laag (=goedkoop). Dus u kunt voor (relatief) weinig geld zekerheid kopen van bijvoorbeeld een Euribor tarief van 0.25%. Dat is een mooi tarief en over 2 jaar ziet de wereld van de rente er volgens mij echt heel anders uit.
Hoe werkt de variabele Euribor rente?
Heeft u een lening met een variabele Euribor-rente, dan kan uw rente veranderen. Want stijgt de Euribor, dan stijgt uw rente mee. En omgekeerd: als het Euribor daalt, daalt ook uw rente. Heeft u bijvoorbeeld een lening met een 1-, 3- of 6-maands variabele Euribor-rente? Dan betekent dit dat uw Euribor-rente één keer per maand, één keer per drie maanden of één keer per zes maanden kan wijzigen.
Wat is een rentecap?
‘Cap’ betekent ook wel ‘plafond’ of ‘top’. Bij een rentecap spreekt u met uw bank een Euribor-renteplafond af: de ‘caprente’. Stijgt het Euribor boven het afgesproken plafond? Dan bent u daartegen beschermd: u betaalt maximaal de caprente (plus uw opslag). Maar daalt het Euribor onder uw plafond? Dan profiteert u van het lage Euribor. U betaalt de lagere variabele Euribor-rente. Voor het afsluiten van een rentecap betaalt u een éénmalige premie aan de bank.
Hoe werkt de rentecap?
Wilt u een rentecap naast uw lening? Dan werkt het Euribor-plafond zo:
1. Voor uw lening betaalt u aan uw bank de variabele Euribor-rente en uw individuele opslag.
2. De bank bekijkt of u een bedrag terugkrijgt:
Is het Euribor hoger dan uw renteplafond? Dan ontvangt u het verschil terug.
Is het Euribor lager of gelijk aan uw renteplafond, dan ontvangt u niets. U betaalt per saldo: maximaal de caprente plus de individuele opslag. Daarnaast betaalt u éénmalig een premie aan uw bank.
Wat spreek je met elkaar af in een rentecap overeenkomst?
In de rentecap overeenkomst worden de onderstaande dingen afgesproken:
1. De hoogte van het plafond voor de variabele Euribor-rente (Caprente of Capstrike).
2. Hoe lang het Euribor-renteplafond geldt (begin- en einddatum). Anders gezegd de looptijd.
U kunt een rentecap afsluiten voor maximaal 10 jaar. Als u de rentecap wilt kopen op een variabele lening met een vaste looptijd mag de rentecap nooit langer lopen dan de looptijd van de lening.
3. Het bedrag waarvoor deze rentecap geldt. Anders gezegd, de hoofdsom.
U kunt een rentecap afsluiten voor het hele leenbedrag of voor een deel, bijvoorbeeld 50% van het leenbedrag. Er geldt een minimumbedrag van € 250.000,-. Sluit u een rentecap af voor een deel van het leenbedrag? Dan blijft u voor het overige deel risico lopen op stijging van de variabele Euribor-rente.
Wat kost een rentecap?
Als u een rentecap afsluit, betaalt u éénmalig een bedrag aan de bank: de premie. In de premie zit ook de vergoeding voor de bank verwerkt (marge). Daarnaast hoeft u geen andere kosten aan de bank te betalen. De hoogte van de premie hangt onder meer af van de caprente, het hoofdsomverloop en de looptijd van de rentecap. Daarbij geldt: hoe hoger het Euribor-renteplafond, hoe lager de premie. En: hoe langer de looptijd, hoe hoger de premie.
Wat gebeurt er met uw rentecap als u de lening vervroegd aflost?
Lost u de lening vervroegd af? Of stopt de lening om een andere reden eerder dan afgesproken? Dan heeft u de rentecap niet langer nodig. De bank heeft dan het recht om de rentecap stop te zetten. Overweegt u uw lening vervroegd terug te betalen, laat dit dan weten aan uw relatiemanager en uw treasury adviseur. Uw rentecap verandert namelijk niet automatisch mee. Uw treasury adviseur kan u informeren over de gevolgen voor uw rentecap.
Wat als de rentecap eerder stopt dan afgesproken?
Stopt de rentecap vóór de afgesproken einddatum? Dan verrekent de bank op dat moment de ‘marktwaarde’ van de rentecap met u:
Heeft de rentecap marktwaarde? Dit is het geval als de Cap rente lager is dan de actuele Euribor rente. U ontvangt dan een bedrag van de bank. Heeft de rentecap geen marktwaarde. Dit is het geval als de Caprente hoger is dan de actuele Euribor rente. U ontvangt dan niets.
De marktwaarde van de rentecap is afhankelijk van de resterende looptijd, de hoofdsom, de actuele en verwachte Euribor-rente en de beweeglijkheid van de markt. Goed om te weten: de marktwaarde van de rentecap is nooit minder dan nul Euro. U betaalt dus nooit een bedrag aan de bank bij eerder stopzetten van de cap.
De premie in termijnen betalen
Wilt u een rentecap afsluiten, maar de premie niet in één keer vooraf betalen? Dan kunt u kiezen voor gespreide premiebetaling. U betaalt de premie dan in termijnen, bijvoorbeeld per maand, of per kwartaal. Belangrijk om te weten: Bij gespreide premiebetaling is de premie hoger.
Eindigt de rentecap voortijdig, bijvoorbeeld omdat u de lening vervroegd heeft afgelost? Dan moet u de resterende premie nog wel betalen.
Voorbeeld:
Stel u heeft een lening of werkkapitaal financiering van EUR 1.000.000.
U betaalt nu als basis het 1 maands euribor van -0.35% (waarschijnlijk heeft u een bodem van 0%, jammer en vreemd genoeg). U heeft een kredietopslag van 2.00%
U betaalt per saldo 2.00% over 1 maand bij een minimum van 0%. Dit is over EUR 1 mio = EUR 1.722.22 aan rente per maand.
U betaalt per saldo 1.65% als u geen minimum heeft van 0% = EUR 1.420.83 aan rente per maand
Stel u koopt een Cap (=renteplafond) op 0.25% voor 5 jaar startend 01-01-2017 t/m 01-01-2022
Daar betaalt u voor vooraf EUR 10.500,–
Dat is EUR 2.100,= per jaar.
Het maximale rentetarief wat u betaalt op uw rekening-courant = 0.25% + 2.00% opslag = 2.25% en daar betaald u EUR 2.100 per jaar voor (= 0.21%). Dat is EUR 175.00 per maand. Dat lijkt me in deze onzekere tijden een prachtige verzekering van uw rentekosten. Dan betaalt u dus maximaal 2.46% per maand (0.25% rente plafond +2.00% kredietopslag + 0.21% premie van de cap = 2.46%). U betaalt nu 2.00% per maand.
Dus u bespaart rente als het 1 maands Euribor boven de 0.46% uitkomt.
Als het Euribor 5 jaar lang onder de 0.25% blijft, heeft u EUR 2.100 per jaar weggegooit. Dat is waar. Maar als het Euribor in die 5 jaar stijgt naar bijvoorbeeld 1.00% dan betaald u per maand zonder Rentecap EUR 2.583.33
En met Rentecap EUR 2.118.33 (hierin zit de premie meegerekend). Verschil = EUR 465 per maand (= EUR 5.579.96 per jaar).
Koopt u een rentecap op 0% voor 5 jaar. Dit is vaak ook de rente die u nu betaalt dan kost dit u EUR 12.800. Dit is EUR 2.560 per jaar = EUR 213.33 per maand (= 0.25%) voor de zekerheid op een maximaal Euribor van 0%
Ik vind het een goed idee. Als u het ook een goed idee vindt neem dan contact op met mij op of met uw bank. Als u ondersteuning zoekt, dan ben ik er voor u.

Owner at Erna Erkens Valuta Advies (EEVA)
 Eerst moeten we weten hoe je een naderend faillissement herkent. Als ik zelf een aantal signalen moet noemen dan zijn dat: Liquiditeitsproblemen en zodanig, dat meer dan 60 dagen te laat betaald wordt aan crediteuren. Negatief eigen vermogen en veel personeelsverloop.
 Maarten Verheul – Treasury Consultant
 Who is not yet convinced of the potential of blockchain? Here is another example that shows blockchain is beyond the hype. Early September, the Hyperledger Project, a collaborative cross-industry effort to advance blockchain technology, announced that 17 new companies and organisations have joined, bringing the total number of members to more than 80. And expectations are that this number will see a further growth, to beyond 100 at the end of 2016.


 Afgelopen week stuitten we op het bericht dat ruim 20 miljard aan liquide middelen vast zit in het werkkapitaal van toonaangevende organisaties in Nederland en België. PwC deed een werkkapitaal onderzoek en ontdekte dat er nog genoeg mogelijkheden zijn om de werkkapitaal situatie van deze organisaties te verbeteren.(Bron:
 De treasurer en de controller zouden twee handen op dezelfde buik moeten zijn, maar de vraag is of dat in alle, of zelfs de meeste, gevallen wel zo is. Enkele uitzonderingen daargelaten, zijn de verschillen groter dan de overeenkomsten.
 Na de vakantie is het tijd om de eerste stappen te zetten voor het budget voor het volgend jaar. Toevallig kwam budget ook aan de orde in de discussie over CF Planning. Kosten overschrijdingen in het budget verstoren de CASH. De CF Planning is grotendeels op het budget gebaseerd. Het banksaldo moet aansluiten op de gebudgetteerde balans, want maak niet alleen een budget op W & V niveau, maar ook op Balans niveau. Denk daarbij ook aan uw Investeringsbudget voor de balans, investeringen, desinvesteringen en afschrijvingen.
 Netting is mainly used by global operating companies with a large number of subsidiaries; the reach of netting can however also include smaller company structures and save a lot of handling and costs.
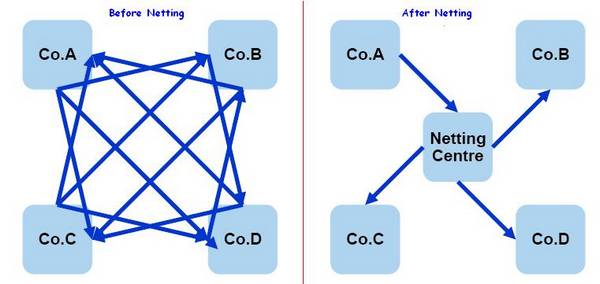
 Jan Meulendijks – Cash management, transaction banking and trade professional