Financial decision-making under uncertainty
| 19-07-2016 | Willem van Overveld |
 One of the drawbacks of modern financial modeling in its most rudimentary form (projected P&L, Balance Sheet and Cash-flow statement) is the absence of uncertainty in the equation. Let’s presume you have built an excel model where all the common financial statements are present, accompanied by a capital budget and a loan sheet. With relational checks between accounting statements, you as the financial analyst manage to keep all these statements neatly tied together.
Although you assume you have done a good job, you have to remind that you only have plotted one of the many millions of possible outcome scenarios in the forecast. It would be absurd to base your financial decision-making on just one of the millions of possible outcome scenarios, if you have the computing power to calculate more, and say something about a frequency distribution.
By introducing uncertainty in the financial model, it becomes possible to get a grip on the likelihood of simultaneous deviations from your original financial planning. This means that you have to randomize key financial parameters within a specified bandwidth, using an excel formula RND(…,…) and calculate many thousands of possible combinations.
This method is known as Monte Carlo Simulation. Instead of discrete modeling you get a distribution of returns which can lead to statistically better informed judgements. Let’s say you want to specify a growth bandwidth between -1% and 3%, and an interest rate bandwidth between -1 and 4%. In addition your inflation index on salaries is somewhere between 2% and 5%. You want to calculate 100.000 combinations of these randomized parameters in steps of 0,1% or smaller. The result would look like a graph like this.
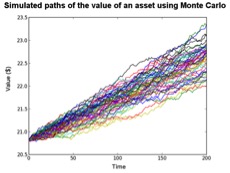
By using statistical techniques you can say something about the shape and skewness of the frequency distribution and the likelihood of a certain scenario bandwidth at a certain point in time.
Ultimately with some simple tools, this analysis gives a greater insight in the likelihood of crossing boundaries in the loan convenants that you agreed upon with your bank. If you can say: ‘with 97% certainty we stay within the agreed upon boundaries in the financing arrangement, given 100.000 different scenario’s with a bandwidth of x’, gives more reassurance to a bank than saying: ‘in this discrete model our prospects are good’.
In tight capital markets this type of modeling could make the difference between making the deal or not. If you want to know more about the methodology, do not hesitate to contact me under the credentials given below.
 Willem van Overveld – Allround finance / treasury professional
[social_links size=”normal” align=”” email=”[email protected]” facebook=”” twitter=”” google=”” linkedin=”https://www.linkedin.com/in/willemvanoverveld” youtube=”” vimeo=”” flickr=”” instagram=”” behance=”” pinterest=”” skype=”” tumblr=”” dribbble=”” vk=”” xing=”” soundcloud=”” yelp=”” twitch=”” deviantart=”” foursquare=”” github=”” rss=””]