Tag Archive for: Treasury for non treasurers

Commercial Paper – alternative short term funding

| 03-01-2018 | treasuryXL |


There are many different products that a company can use to meet its funding requirements. These products mainly fall into (but are not exclusive to) 2 major categories – equity or debt. Within both categories that are many different bespoke products that can be used. Debt can be either for long term or short term – both in respect to the tenor and the interest rates. Furthermore, interest rates can be fixed or floating. In this series we shall be looking at popular products that are used to help fund a business.

Definition
Commercial Paper is a money market product issued by large companies to receive funding for short term needs. The tenor (maturity) is normally for a short period up to 270 days. The paper is a promissory note that is unsecured – there is no collateral/security offered against the paper. As such Commercial Paper is normally only ever issued by large well-known companies who have credit ratings.

How it works
When a company needs short term funds it can issue paper (promissory note) against receiving the funds. Issuance can take place either via a recognized dealer who can sell the paper into the money markets, or paper is directly issued to an investor who wishes to buy and hold the paper until maturity. Paper is normally issued at a discount to its face amount and redeemed at par.

The programme
Commercial Paper is subject to a company issuing a programme. This provides details as to the maximum amount that can be borrowed; the lifetime of the programme; registered dealers etc.

Why borrow?
Commercial Paper allows a company to be flexible in its short term funding. Yields are, traditionally, lower than bank borrowings and are not subject to additional bank covenants. A company can benefit quickly from changes in interest rates. It is both a quick and inexpensive way to raise short term working capital.

Why lend?
It allows lenders to get a better yield than available if they placed their funds on deposit with a bank. The paper is negotiable – this means that the paper can be sold on in a secondary market. If a lender suddenly had a funding issue, they could sell the paper to a third party, rather than approaching their bank for funding. As the issuers have credit ratings, it is possible to apply your own criteria with regards to who you will accept as a counterparty.

Lionel Pavey


Lionel Pavey

Cash Management and Treasury Specialist


Financial Options – the right but not the obligation

| 05-12-2017 | treasuryXL |

Debt ComplianceIn the financial industry an option is an instrument, based on financial derivatives, that enable the buyer of the option to obtain the right, but not the obligation, to buy or sell an underlying product/asset at an agreed price on or before a certain date in the future. As simple descriptions go, this requires a lot of understanding about different subjects. It is the intention of this article to clearly explain all the terms mentioned above.


Financial derivative
The value of an option is specifically linked to the price of an asset – referred to as the underlying instrument. This could be a share, bond, currency pair, interest rate etc.

Right, but not the obligation
When you purchase an option, this gives you the right in the future to exercise the option with the counterparty. However, you are not obligated to exercise your right.
If you have bought an option with the right to buy an asset, but the price of the asset at maturity is lower than the agreed price on the option, you are not obligated to buy the asset as it would be cheaper to buy the asset in the open market at the lower price. However, the seller of the option always has the obligation to sell to you if you exercise your option

Agreed price
This is called the strike price – it is a fixed price. If you purchase an option that gives you the right to buy the underlying instrument at EUR 65 and the market price rises to EUR 75, then you would exercise your right under the option to receive the underlying instrument at EUR 65 and either hold or immediately sell at EUR 75 for a profit (as long as the premium was smaller than EUR 10).

Buy or Sell/Call or Put
If you want the right to buy an asset in the future you purchase a Call option.
If you want the right to sell an asset in the future you purchase a Put option.

Agreed date
This is called the expiration date and means that after that date no future transaction can be derived from the option – the option expires on that date.

Premium – the cost
When you purchase an option, the seller receives a financial settlement upfront. This is called the premium. As an option can be compared to an insurance policy, the premium on an option is similar to the premium paid upfront on an insurance policy.

Premium – the price
Major components used to determine an option price include interest rates, time to expiry, volatility, intrinsic value and the current asset price. Interest rates are used to determine the time value of money between now and the expiry date. Volatility is a measure of the dispersion of the price as in statistical analysis – volatility is another word for uncertainty. The more uncertainty there is, the greater the effect on the option price. Intrinsic value is the difference between an asset’s current price and the strike price.

The underlying
This refers to the specific asset that is being traded. Normally trading is an agreed lot size. 1 option would represent 100 shares for example.

Secondary market
If options are traded with an exchange, then there is a secondary market. You could buy an option, see the price rise, but consider it would not reach the strike price. Your option could then be sold to a third party via the exchange for a higher price than the premium you paid.
If you trade privately (over-the-counter) then your option can not be sold to a third party.

Types of Options
American – can be exercised on any day before or on expiring date
European – can only be exercised on the expiry date
More exotic variations like Bermudan, Binary and Exotic

Why trade Options?
Options give you exposure to an underlying asset at the cost of the premium as opposed to the full face value. This means your position can be leveraged for the same sum of money. If you hold an asset, you can also write the underlying option – a strategy called covered option. You own the asset and receive the premium reducing the cost of the asset. But if exercised, you must deliver the asset.
You could be looking at an acquisition – by purchasing options you would have the opportunity to buy the underlying at agreed prices before the market moved up. If the acquisition fell through, it would only cost you the premium.

Options that you did not know you had bought
Early repayment of a mortgage without a penalty is a form of embedded option.
Bonds that have a convertible character – exchange at a pre-agreed price for stock
If you have arranged a credit facility via a bank for an agreed period of time, you have paid for the option to drawdown against the agreed line of credit.

Who wins?
Studies show that 75% of all options that are purchased expire without being exercised. Obviously, the winners are the writers of options as they receive the premium but are not obligated to perform. This is mostly due to changes in the market or the timing being wrong. If you purchase a call option, then you must add the premium to the strike price to obtain your gross purchase price. Only if the price rises above the gross price is it rewarding to exercise the option.

Lionel PaveyLionel Pavey – Cash Management and Treasury Specialist

[button url=”https://www.treasuryxl.com/community/experts/lionel-pavey/” text=”View expert profile” size=”small” type=”primary” icon=”” external=”1″]

[separator type=”” size=”” icon=””]


Debt Compliance – can you make the grade?

| 01-12-2017 | Paul Stheeman |

Debt ComplianceWe welcome a new expert – Paul Stheeman, who immediately brings us an interesting topic that has not been covered in much detail up to now. It goes to show that there are many facets in the role of treasurer and we can constantly find new subjects that have not been approached. Thank you, Paul.

Depending on the financing method chosen, your company is likely to have debt or some kind of financial obligations to third parties. This can be in the form of loans, bilateral or syndicated, or in the form of a bond issue. In each case, the underlying agreement has to be well-documented and could be very extensive with several hundred pages of legal language which, for a non-lawyer, may be very difficult to understand.

In that documentation there will be clauses stating what the debtor is allowed and not allowed to do. Another important part of the agreement will be around financial covenants. These are usually ratios which the debtor has to regularly fulfil. It is commonly the responsibility of the Treasurer to ensure that the terms of the agreements are adhered to and to report the status of the covenants to the lenders and investors. To be able to do this the Treasurer will have to work closely with the company’s lawyers, the accountants and the Controller. He furthermore has to “educate” key internal stakeholders in the requirements, so that they also are aware of any hurdles which may prohibit them in carrying out their day-to-day business. This whole process is commonly known as debt compliance.

A loan agreement will typically have between one and five financial covenants which need to be tested and reported to the lenders on a quarterly or semi-annual basis. One of many examples of financial covenants is a coverage covenant, which requires the debtor to maintain a minimum level of earnings or cash flow relative to certain expenses, e.g. interest or debt service. Typically, such numbers are prepared in the accounting department, but the Treasurer will have to ensure that these figures are prepared timely and are within the thresholds allowed in the financing agreements. If these criteria are not met, then the debtor will be in breach of the covenant(s) and technically will be in default.

Default can also arise when so-called prohibited transactions are entered into or “basket” limits are overdrawn. In many agreements the debtor is not allowed to enter into any other financial obligation. This may in practice prohibit the debtor in carrying out his normal course of business. For example, he may be required to issue a performance guarantee. This would initially not be allowed under the agreement. Lenders therefore establish baskets with a threshold amount up to which the debtor may have a bank issue a performance guarantee. Again here, it will be the Treasurer’s responsibility to ensure that all such transactions fall within allowed business or baskets.

Being in default due to a breach of a covenant or a basket could mean that the outstanding debt becomes immediately repayable in full. This is usually neither in the interest of the debtor or the lender, so that the lender can apply for a waiver. It will depend on the seriousness of the breach, but these waivers are often agreed to by the lenders. However, there will be a fee which the lender will have to pay for the waiver and this can be quite substantial.

To summarize, debt compliance is a very important part of a Treasurer’s role as the consequences of non-compliance can at best weaken the company’s position towards its lenders and at worst be disastrous as lenders call on outstanding debt to be repaid immediately.


Paul Stheeman

Owner of STS – Stheeman Treasury Solutions GmbH


How does a FX Forward transaction work?

| 27-11-2017 | treasuryXL |


We are curious; Do you see foreign currency market volatility as a significant risk to your company? Poll powered by Grain

FX Forward Contract

A Foreign Exchange Swap (also known as a FX Forward) is a two-legged transaction where one currency is sold or bought against another currency at a determined date, and then simultaneously bought or sold back against the other currency at a future date. Normally this means the first transaction would take place at the prevailing spot rate and settle on the spot date, whilst the forward transaction would prevail at an agreed forward rate and settle on the agreed forward date. The difference between the Spot price (or first price) and the Forward price (or second price) represents the FX Forward and is expressed as Swap points.


What are Swap points?

Swap points represent the cost of borrowing one currency, whilst simultaneously lending another currency for a time period equal to the swap period. Swap points are therefore the cost of carry netted out between two currencies and used to adjust the existing Spot price to express the Forward price.

Worked example

Currency 1 ABC
Currency 2 XYZ
Period 6 months
Days in period 183
Interest rate 6 months ABC 4%
Interest rate 6 months XYZ  7%
Spot ABC/XYZ 2.1025

For ABC 1,000,000.00 there are XYZ 2,102,500.00

ABC 1,000,000.00 * (1+4/100*183/360)     = ABC 1,020,000.00
XYZ 2,102,500.00 * (1+7/100*183/360)      = XYZ 2,177,313.96

XYZ 2,177,313.96/ABC 1,020,333.33 = 2.1339

Swap points = +/+ 314 pips

What does this mean?

The Forward price of 2.1339 is higher than the Spot price of 2.1025 and means that the currency ABC trades at a forward premium to currency XYZ. Therefore, the Swap points of 314 pips are added to the current Spot price. A bank that is quoting would only quote the Swap points. A two-way quote would look something like 304/324. At 304 the bank would sell and buy ABC – spot against 6 months – against buying and selling XYZ. At 324 they would do the complete reverse.

So is the Forward price the same as a future?

No, the Forward price is not an attempt to determine the future value of currency ABC expressed in the price of currency XYZ. It is a price that is derived by notionally hedging the notional values of both currencies against their respective interest rates that are applicable at that moment in time. The Forward price is an example of interest rate parity – a state of non-arbitrage or equilibrium where traders are indifferent to either as there is no monetary advantage in either. Forwards are traded ‘Over the Counter’ and not via an exchange. Regardless of what the future value of spot ABC/XYZ is, once the trade has been executed there can only ever be opportunity loss or profit in the bookkeeping.

Variations

FX Forwards can also be forward starting – a client might wish to create/hedge an exposure starting in 4 months’ time and with a tenor of 6 months. This would be seen as a 6 month starting in 4 months’ time – or a 4m*10m. Such a Forward would be calculated from the present spot to both 4 months and 10 months, with the present Spot rate adjusted for the Forward price for 4 months to reflect the new starting price.

Alternatively, instead of swapping a position, a client might just wish to hedge their exposure/obligation in the future by trading ‘Outright’. If they were to buy ABC forward they would enter into a FX Swap (sell ABC at spot and buy forward) and then immediately buy ABC at spot, offsetting the spot leg of the FX Swap.

What moves the price?

Changes in the underlying interest rates of both currencies will affect the calculation. Also as the interest rate differential of the two currencies is expressed as a price of the existing spot rate, changes in the spot rate will also cause changes in the outcome of the calculation – though generally smaller than those caused by changes in interest rates.

Why trade FX Forwards?

FX Forwards allow a company to hedge future exposure/obligations. Once the contract has been struck that value is confirmed and is not subject to ‘mark-to-market’ variation orders as happens with an off-balance-sheet instrument. An exposure in one currency can be transformed into another currency via use of a FX Forward. An expected inflow or outflow that is delayed can be rolled forward by using a FX Forward.

Lionel Pavey


Lionel Pavey

Cash Management and Treasury Specialist


How does a FX spot transaction work?

| 14-11-2017 | treasuryXL |

Every day we enter into transactions in our own domestic market. Goods are priced in our own currency and we settle purchases in our own currency. Here in the Netherlands that means everything is priced and settled in Euro’s. It is a clear and concise system – of course we might argue about the price of goods, but that is another matter. Now consider what happens when we sell our goods to a counterparty domiciled in a different country – we shall assume from the United States. We would prefer to invoice in EUR as this is our domestic currency, whilst our counterparty would prefer to settle in USD. This makes sense as in both instances neither of us would be exposed to fluctuations in the exchange rate between the EUR and USD.

There are 3 basic choices to trade with a foreign based counterparty:

  • Price in our currency, but run the risk that they will not trade with us
  • Price in their currency, win the trade but do nothing about the risk
  • Price in their currency, but adjust our price for the perceived FX risk and sell their currency for our currency as soon as the deal is closed

As we are keen to expand our export markets we agree to charging the buyer in USD, but what price should we charge in USD? By accepting payment in USD we are now assuming a foreign exchange risk as the value of the USD could fall in relationship to the EUR before we have sold the USD for EUR. If the fall was large it could take away all our profit from the original transaction, possibly even leading to a loss on the order.

We must therefore enter into a transaction to sell USD and to receive EUR to book our profit and to neutralize the FX risk. This leads us into the world of Foreign Exchange (FX) trading.

In FX trading quotations are always shown for a pair of currencies such as EUR/USD – but what does this mean?

  • The first currency – EUR – is called the base currency
  • The second currency – USD – is called the quoted currency
  • The spot rate is shown as 1.1595
  • This means that every unit of the base currency is equal to 1.1595 units of the quoted currency

If our order was for EUR 100.000,00 then the USD equivalent would be USD 115.950,00

In this example it is the USD price that fluctuates as it is the quoted currency, but this does not mean that fluctuations are only caused by changes in the value of USD. The value can also fluctuate because of changes in the value of EUR – even though this is the base currency.

Most major currency pairs are quoted to 4 decimal places – with the 3rd and 4th places being called “pips”. Pips are the expression traders use to describe their profit or their market spread.

If we traded EUR 1 million into USD, we would have an equivalent of USD 1.159.500,00

The value of 1 “pip” would be USD 100,00

When we approach a bank for a quotation in spot EUR/USD, the bank quotes a 2-way price such as 1.1592/97

The lower price – 1.1592 – represents the bank’s bid price. This is the price at which the bank buys EUR and sells USD.

The higher price – 1.1597 – represents the bank’s offer price. This is the price that at which the bank sells EUR and buys USD.

If the bank quoted this price into the market and one clients hit the bid at 1.1592 and another took the offer at 1.1597, both in EUR 1 million, then the bank would book a profit of USD 500,00 – or a profit of 5 pips on EUR 1 million.

FX is one of the largest markets in the world – daily turnover exceeds USD 5 trillion per day. That means 5 followed by 12 zeros – every working day.

With such a large daily turnover, prices are constantly changing. The market consists of price makers (who make the prices), price takers (who take the prices), intermediaries like brokers who assist the market by transmitting the prices and placing orders, and clients who place orders at specific levels. Prices are only valid for a few seconds before they change either because the market has traded on the quoted price or a new order replaces the existing price.

When you trade on the quoted price then you have entered into a binding contract with the counterparty. Settlement is normally 2 working days after the trade date. If you sell USD then you must ensure your counterparty receives the agreed USD amount on their account in 2 working days, and you receive the agreed EUR amount on your account in 2 working days.

Trade settlement is very important and means that you must have a complete operational procedure in placing to effect settlement, establish positions, agree counterparties, have trading limits etc.

Traditionally spot FX trades were done with banks. Now trades can also be transacted via electronic exchanges, electronic brokers etc. It is always important to know who your counterparty is – it could be that your internal operational control prohibits you from trading with specific counterparties.

Most major currencies can be traded against each other without restrictions such as exchange control. Therefore, currency pairings can be found everywhere such as USD/JPY and EUR/GBP and ZAR/CHF.

Spot FX transactions are not traded on listed exchanges; these trades occur “over the counter” with a clearly identifiable counterparty.


Lionel Pavey


Lionel Pavey

Cash Management and Treasury Specialist


What do you want to know about Treasury?

| 30-10-2017 | treasuryXL |

It has always been our mission to promote Treasury as a profession and to increase the awareness of Treasury within business. Currently there are more education choices for students to study and appreciate Treasury, but we still felt there was a gap – knowledge for anyone who was genuinely interested in learning more about Treasury.

With this in mind, we decided to proactively launch a new initiative – Treasury for non-treasurers. We consider this as our call to action.

Who are these people?

These can be students; career professionals in other disciplines who are curious; people in the finance industry who are considering either a career change or specializing in the field of Treasury; anyone who just wants to understand what a treasurer does on a day-to-day basis.

What is our aim?

Having always written for the professional, we were confronted with the challenge of getting our information across to people who do not have in depth knowledge. After a lot of research and analysis we decided that the best approach would be to attempt to simply explain the workings of Treasury, without going into too many technical details.

What will be in our articles?

With our knowledge, that relies also on the invaluable input of our expert community, we are considering a framework encompassing such topics as:

  • Treasury department – roles and responsibilities
  • Financial products for trading – Spot FX, Forwards, Options, Futures
  • Financial products for liquidity – deposits, loans, commercial paper
  • Financial products for financing – private placements, bond issues, equity
  • Cash flow forecasting – models and procedures
  • Working Capital Management – payables, receivables, inventory
  • Risk management – interest rate, FX, commodity, credit, liquidity, operational
  • Fintech – Treasury Management Systems, inhouse, exchanges
  • Cash concentration – physical sweeps, notional pooling, overlay structures
  • Education – study, on-line courses, sources of data
  • Economic and political – inflation, unemployment, leading and lagging indicators

This is a comprehensive and challenging list – but not impossible – which will, hopefully, increase people’s understanding and perception of the treasury function.

What we need?

Feedback – and plenty of it please.

These articles will not be written chronologically but, if there are certain topics that you wish to have explained then please do not hesitate to contact us. It is only with your input that we can truly create a service to meet your demands. We think we know what you would like to know, but only you can tell us!

What next?

Hopefully, when the series is a success, we can consider publishing e-books. Credit would always be given to those they have taken their time and effort to impart their knowledge and wisdom to others.

Who are you?

Please feel free to contact us and let us know more about you:

  • What is your profession/vocation?
  • What industry do you work in?
  • What interests you about Treasury?
  • Are you interested in making career choices?
  • Need help for your company, but are too small to have in-house expertise?
  • What do you think about the finance industry?
  • What do you think about the EURO?
  • How about Brexit?

So, come back regularly and watch this space!!

Tell me and I’ll forget. Show me, and I may not remember. Involve me, and I’ll understand.

[button url=”https://www.treasuryxl.com/contact/” text=”Contact us” size=”small” type=”primary” icon=”” external=”1″]

[separator type=”” size=”” icon=””]

How to connect to your bank electronically

| 26-10-2017 | François de Witte |

One of the main challenges in treasury is ensuring the connectivity with your banking partners. Currently corporates use the e-banking, or “electronic banking” channels. ‘Electronic banking’ can be defined as the way in which a company can transmit transactions and obtain reporting instructions to a bank remotely and electronically.

In the present article about bank connectivity, we will outline the current types of e-banking channels in the market, their advantages and the attention points.

Interactive banking channels

For interactive e-banking channels, typically the communication is initiated by the corporate client from a PC within the finance department and the instructions are transmitted to the bank through the internet.

Banks are developing their portals more and more: ING Business Payment, Connexis, KBC-Online, IT Line, RABO Corporate Connect, etc. They also provide a full range of services through them.

Illustration of the interactive electronic banking channel:
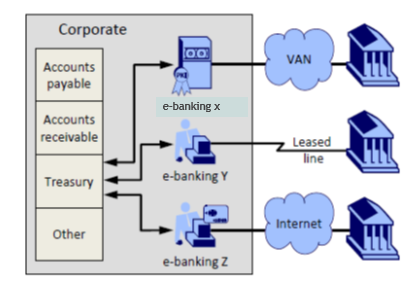


Currently the interactive- banking channels are widely used by corporates and other organizations, because they are easy to implement, user-friendly, enable to work on a standalone basis and less expensive. However, the drawbacks are that they are not always that suited for mass payments, and that each bank has its own system. Consequently, if you work with different banks, you will have different electronic banking channels for each bank, which adds to the complexity.

In some countries, the banks have put their efforts together to create a multibank interactive electronic banking channels (e.g. Isabel 6 in Belgium and Multiline in Luxembourg).

In my view, the interactive e-banking channel is best suited for corporates having not too high volumes of transactions and working with only few banks, or in countries were multibank electronic banking channels are available.

Host to host electronic banking channels

Some corporates or public institutions have very high volumes to treat, and will need for this a specific direct connection with their bank, a so-called “host to host” (H2H) connection. This is an automated solution for high volume data transfer between banks and their corporate clients.

Sophisticated H2H connectivity solutions give banks the flexibility to exchange information with their corporate clients in preferred file formats, agreeing on network protocols, and security standards.

The following figure illustrates this type of e-channel:
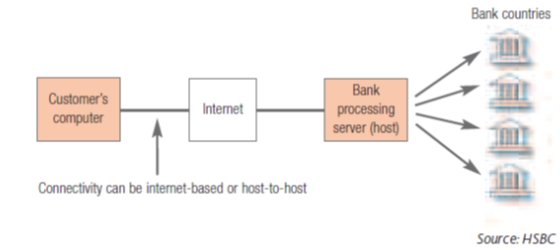


H2H e-banking channels allows for automated payments and collections, attended (where the client needs to take an action) or unattended (directly initiated by the IT system) connection / authorization. They can treat very high volumes, and to integrate the data into ERP systems.

However, they are also more expensive, because they require a specific IT set-up and usually the services of a middleware provider to ensure the connectivity between your ERP or IT system and the bank.

Up to some years ago, corporates had to set up H2H connections with each of their banks, but now several multibank H2H solutions have been developed by the TMS (Treasury Management Systems) providers or by other multibank providers such as TIS, MultiCash and Power2Pay.

In some countries, the banks have set up common interbank protocols enabling an easier and standardized connection. The best know is EBICS, which is currently in use in Germany and France.

In my view, the host to host banking e-channel is best suited for corporates having very large volumes of transactions and requiring a high level of integration with their ERP or IT systems.

SWIFT e-banking

SWIFT has extended from a bank-to-bank platform to a corporate-to-bank platform, and has also launched its own bank connectivity solution, SCORE (Standardized Corporate Environment). SWIFT enables hence to replace the various e-banking systems with a single, bank-neutral multibank e-channel. This means that treasurers and finance managers can connect with their banks worldwide in a consistent way using industry-recognized standards.

Outline of a SWIFTNET Multibank set-up (source SWIFT):
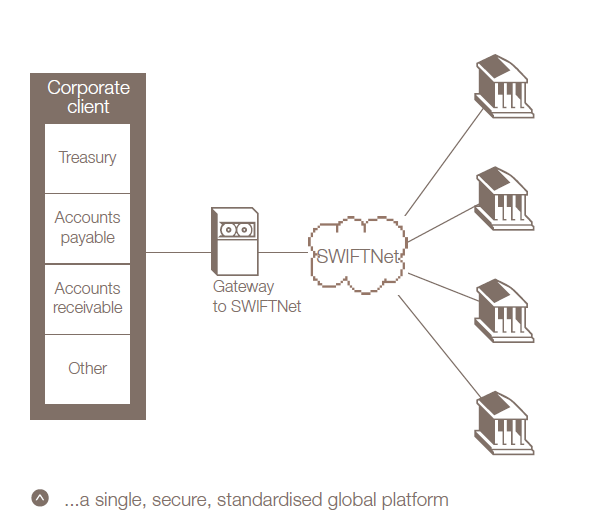
Companies can connect to SWIFT in many ways. One option is to establish a direct connection to SWIFT, but this can be a technically complex exercise. As a result, many of the companies connecting to SWIFT do so via a SWIFT service bureau. In such a set-up, most of the technical challenges are resolved by the service bureau

The third SWIFT connectivity option is Alliance Lite2. This solution enables corporates to connect to SWIFT in a quicker and less expensive way.

The SWIFT channel offers, beside the multibank character, many other advantages, such as the SWIFT standards, services beyond payments, such as FX and deposit confirmation and securities transactions, and an improved security / reliability compared to the classic e-banking systems

However, the Swift e-banking solution is not easy to implement, and can be quite expensive (in particular for the direct connection and the connection through a service bureau. Hence this solution is more suite for very large corporates and institutions, working with many banks.

Conclusion:

When looking at setting up the e-banking connectivity, several factors need to be taken into consideration, such as the number of banks and transactions, the complexity of the organization and the treasury. Smaller organization can perfectly work with the interactive e-banking channels, whilst larger and more complex organizations need to consider the multibank H2H connections or a SWIFT setup.

In the framework of PSD2, with the XS2A (access to accounts), banks in the EU/EEA will have to provide access to authorized third parties. I expect that thanks to PSD2 the cost of multibank e-banking platforms will go down, which is good news for corporates.


François de Witte

Founder & Senior Consultant at FDW Consult

Graphs with no time line – why and how

| 7-8-2017 | Lionel Pavey |

A key role within the Treasury function is providing forecasts to the directors and management. Graphs are a frequently used tool of course.
When constructing graphs it is normal to put time on the horizontal x axis and read the prices from left to right – from old to new. Visually, this appeals to us as we normally read from left to right. However, when the price does not change much for a long period of time the graph no longer looks fluid – there is a period of activity, followed by a long period of almost standing still, followed by another period of activity. To try and eliminate this period of inactivity whilst still presenting the data requires an approach where sequential time is removed from the equation. This brings us to the last article in this series.

The following two graphs ignore time and focus purely on changes in the price that have been filtered to meet specific criteria.

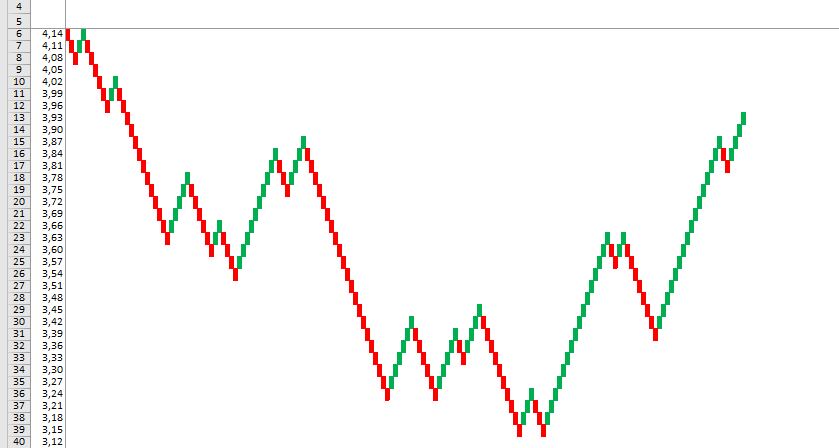
Renko Charts


Prices are represented by blocks – hollow for upward movements and solid for price falls.

Every block has a predefined value – if we were showing interest rates a block could represent 5 basis points. If we had an upward price movement this means that the following upward block can only been drawn once prices have risen more than 5 basis points from the last block. If the price moved up 4 basis points and then dropped by 3 basis points, no additional blocks would be added to the graph.

Blocks are plotted at a 45 degree angle showing upward and downward sloping price changes.
Price reversals are shown when prices have moved more than 2 blocks in the opposite direction. Yet again if we had an upward slope and the price was 1.25 (our blocks are set to 0.05 or 5 basis points) we would require a downward movement of more than 0.15 (15 basis points) to 1.10 to draw 2 solid blocks downwards.

What remains is a very smooth representation of price movements with a uniform value for every block, whilst filtering out smaller movements that have been filtered out by the conditions set on block size.

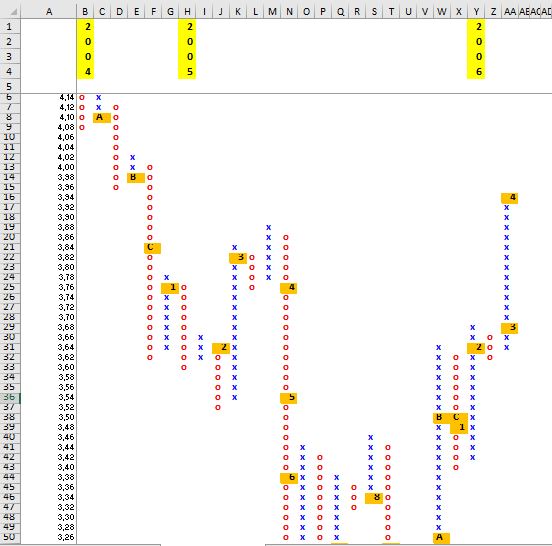
Point and Figure Charts

Price changes are represented by vertical columns – X’s for rising prices and O’s for falling prices.
As with Renko charts, the X’s and O’s have a predetermined size and a price reversal is shown when prices change by 3 boxes as opposed to 2 on a normal Renko chart. When direction changes a new column is drawn to the right of the present column. Otherwise, the same criteria is applied to both charts except point and figure show true vertical columns as opposed to 45 degree lines.

So why would someone look at prices in this particular way? Such a chart does not necessarily show the latest price – the predefined filters ensure that only price changes that meet the criteria are shown.

The main advantages include:

  • A constant filter that reduces the noise associated with normal time charts
  • Analysis is based only on movement – not on time
  • Perceived support and resistance levels are easier to see
  • The current trend is very clear to see

All the techniques shown in this series are applicable to everyday analysis and everyone has their favourite approach. Some like to see all data, whilst others prefer to see filtered, smoother data. The eternal question when looking at charts and seeing the current trend is to ask “where will the price go?” Initially, the immediate answer is that price will follow the current trend until such time as it does not anymore. This might seem a cheap flippant answer, but it is the truth. We have firmly established that we need to know the price in the past to determine if the present price movement is in a clearly established trend. If we knew nothing about the price in the past it would be pure guesswork to say which way the price would go?

We could still be wrong however, but at least we can establish why and how we made our opinion.

No chart or charting system can clearly determine what the future price will be with 100 per cent accuracy. By following the trend we can at least say what the current market direction is, without being able to clarify, purely on price, when the market will change direction.

Charts that eliminate time make it easier to see where the top and bottom of the market prices have been established. Therefore, if we are in an upward trend and approaching a market high that has been reached twice before, we can state with a reasonable amount of confidence that we are approaching a level that the market has tested twice before but not been able to break above. This would imply, on a technical analysis, that there is perceived resistance in the market to taking the price above the previous high.

However, a word of caution when using charts.
The best analogy I have ever heard for not relying 100 per cent on charts is as follows:

Would you sit behind the steering wheel of a vehicle and drive forward whilst the windscreen was blacked out and only have the rear view mirror to show you where you have been and only have that information to decide when you had to steer?

There is no system that can guarantee telling you what the future price will be. Analysis has to be taken with a pinch of salt but, any market professional should be able to perform analysis. If you can not analyse then you can not predict.

Lionel Pavey


Lionel Pavey

Cash Management and Treasury Specialist


You might have missed the first two articles of this series and can find them here:

Treasury for non-treasurers: Data analysis and forecasting – seeing the future by looking at the past (Part I)

Treasury for non-treasurers: Data analysis and forecasting – Seeing the future by looking at the past (Part II)


Moving Averages – how to calculate them

| 1-8-2017 | Lionel Pavey |


In the second article in this series we will be looking at different types of moving averages. Moving averages are used to determine the current trend of a price. They filter out the extremes within a range of data and present a smoother picture. They are almost exclusively calculated using the arithmetic mean. Some studies have been done using the median, though no advantages have been discovered. The following 3 methods are the most common approaches. In all following examples we shall assume an average calculated over a continuous series of 10 data points.

Simple Moving Average (SMA)

We take 10 consecutive values and calculate the simple arithmetic mean. When we calculate the next value we drop the oldest value in the series and add the newest value. We are constantly using the most current data in our calculation. Every data point receives the same weighting i.e. 10 per cent of the complete series. Whilst being very easy to calculate criticism is levelled at the fact that all data points receive the same weighting. This can distort the average when the market is volatile – more recent data is closer to the true market price.

Weighted Moving Average (WMA)

Here the 10 data points are assigned different weights, usually based on a simple mathematical progression. The 10th data point (most recent data) would be multiplied by 10; the 9th data point (second most recent data) would be multiplied by 9; etc. The product of these calculations would then be divided by 55 to produce a weighted average. This weighted average applies more importance on the most recent prices and, therefore, more closely match the current price.

Exponential Moving Average (EMA)

This is another form of a weighted average, but the weighting factors decrease exponentially. As such, whilst the older data points decrease exponentially in value, they never stop. Therefore, this average encompasses considerably more data than the previous 2 examples whilst still being an average calculated with only 10 data points.

The results

EMA is more responsive than SMA. An EMA graph will accelerate faster, turn quicker and fall faster than a SMA graph. This is due to the weighting given to the most recent data. However, these are all lagging indicators – they will always be behind the price. Furthermore, if a market is trapped in a very small trading range the averages will not be as smooth as the actual data. One of the main goals of using averages is to see if prices break out of a range and start a new trend.

Moving averages can be used simply to see what the current trend is. They can be further used by applying different 2 moving averages (one for 10 days and another for 50 days) to ascertain the change in momentum by 2 different time lines. But they all lag the market data.

Most of the time prices will tend to concentrate in a small area, with occasional larger movements up or down establishing the next area of consolidation. Is there an alternative way to design moving averages that take this into consideration?

Adaptive Moving Average (AMA)

Instead of just weighting the data, AMA also look at the price volatility. When prices are in a small range AMA will notice this lack of volatility and provide a trendline that is almost flat. As prices break out of the range AMA will move quickly up or down, depending on the change in prices. The advantages of AMA are that, visually, when prices are reasonably flat (little volatility) a clear flat line is shown so that even if the actual market price is lower than the AMA, it is clear that it is still within a range. As AMA is more sensitive to volatility, it can contain more data about the current trend. An initial breakout from a tight range will result in a very steep line for AMA. The trend can continue, but AMA will clearly show earlier than other averages when the trend is weakening. The only basic problem with AMA is the calculation – it is far more complex to calculate and is not so intuitive when you come to explain it to someone who does not know it.

As stated earlier, all moving averages suffer from lag – they are behind the actual price curve. Our last example is an average that attempts to remove this lag, whilst being more reactive to the current price.

Hull Moving Average (HMA)

Initially, a WMA is taken for 10 data points. Then a WMA is taken for half this period (5 data points) and is calculated with the 5 newest data points. The difference between these 2 is then combined with the WMA for the shorter period to arrive at a new average – the HMA.

The HMA is faster, smoother and eliminates most of the lag that is present in the other moving averages. In fact, it most closely resembles the actual market data.

All these averages are used to attempt to show what the trend is in the actual price, whilst filtering out the noise from all the prices, and presenting the data in a smooth form. Yet again, as previously mentioned, a change in the underlying fundamentals of the price will always have more impact on the price than any form of technical analysis.

However, if we concede that for a large majority of time prices are just trending, a moving average can be used to try and predict when the prices have moved out of their range and are on a new path with fresh momentum until that slows down and the following range is established.

When charting data we need to appreciate the amount of data we will be producing. Even if we just use the price at the start of the day, or the end of the day, we will accumulate at least 255 data points every year. If prices are in a small range, then more data is added to the chart series to provide a more dynamic picture. But this can make the visual data more cluttered once we include the actual data and 1 or 2 moving averages. Would it not be better if we could eliminate time and just look at price?

Read also my first article in this series where I tell you more about several types of forecasts.

In the last article in this series I will look at 2 common methods of showing price data devoid of timelines.

Lionel Pavey


Lionel Pavey

Cash Management and Treasury Specialist


Forecasting the future by looking at the past

| 25-7-2017 | Lionel Pavey |


A key role within the Treasury function is providing forecasts to the directors and management. The most obvious would be the cash flow forecast, but others would include foreign exchange prices, interest rates, commodities and energy.

A forecasts is a tool that helps with planning for the uncertainty in the future, by analyzing data from the past and present whilst attempting to ascertain the future.

Internal – cash flow forecast

We would like our forecasts to be as accurate as possible – that the values we predict are close to the actual values in the future. This requires designing a comprehensive matrix to determine the variables needed for the data input. Data has to be provided by all departments within a company to enable us to build a forecast. This data needs to be presented in the same way by all contributors so that there is consistency throughout.

We also have to see if the forecast data is within the parameters of the agreed budget. We also need to check for variances – why is there a difference and how can it be explained.

External – FX and Interest Rates

A more common approach is to read through the research provided by banks and data suppliers to try and see what the market thinks the future price will be. Also we need to include data from the past – we need to know where the price has been, where it is now and what the expectation is for the future.

Extrapolating forward prices is notoriously difficult – if it were simple, we would all be rich in the future! But, by including past data, we can see what the price range has been, both on a long term as well as a short term basis.

When attempting to find a future value there are 2 common methods used – fundamental and technical.

Fundamental Analysis

Use is made of economic and financial factors both macroeconomic (the economy, the industrial sector) and microeconomic (the financial health of the relevant company, the performance of the management). The financial statements of a company are analysed in an attempt to arrive at a fair value. This leads to an intrinsic value, which is not always the same as the current value.

The value is normally calculated by discounting future cash flow projections within the company.

Technical Analysis

Use is made of the supply and demand within the market as a whole and attempts to determine the future value by predicting what the trend in the price should be. This is done by using charts to identify trends and patterns within the data. This assumes that the market price now is always correct, that prices move in determinable trends and that history repeats itself. Technical analysis uses the trend – this is the direction that the market is heading towards.

Whilst these 2 approaches are independent of each other, they can be used together. You could take a fundamental approach to value a company or asset, and then use technical analysis to try and determine when you should enter and exit the market.

Fundamental analysis is more of a long term path and technical analysis is more short term. The most important thing to remember is that markets only really experience large movements based on changes to the fundamentals. Predicting the long term future only via technical analysis is likely to be incorrect. All the major movements over the last 50 years in the prices of shares, bonds, foreign exchange and interest rates have occurred because of a change in the fundamentals.

In the next article, I will look at various methods of calculating averages to determine the trend.

An economist is an expert who will know tomorrow why the things he predicted yesterday didn’t happen today.

Lionel Pavey


Lionel Pavey

Cash Management and Treasury Specialist