Corporate Treasury Data Insights Refinitiv

07-09-2022 | treasuryXL | Refinitiv | LinkedIn |


The USDCNY historical volatility, the expert webinar on Inflation Growth & Markets, Refinitiv Corporate Treasury Newsbeat and much more. All summarised in the new Corporate Data Insights by Refinitiv.

Chart of the Month

Chart of the month

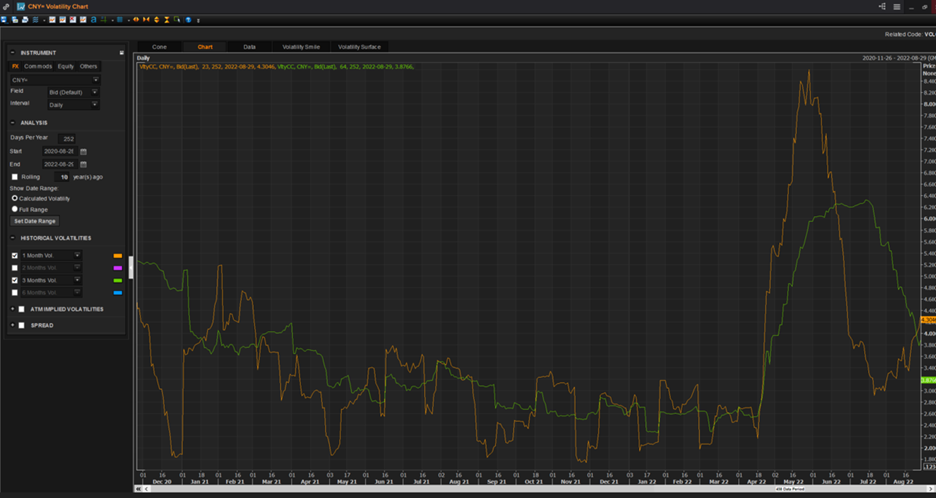
1M and 3M USDCNY historical volatility 


Our Chart of the Month shows 1-month volatility (in orange) and 3-month volatility (in green) for the USDCNY currency pair. It clearly demonstrates huge implications for those hedging CNY exposures.
The combination of USD rate tightening and Chinese rate easing since the start of the year – reflecting a weakening Chinese economy and Covid-19 restrictions – has meant a stronger USD, a sell-off of Chinese bonds, and significantly elevated USDCNY volatility.
Ahead of the November US mid-term elections, commentators are watching to see if Biden’s inflation imperative might outweigh the US response to China’s actions towards Taiwan. Our news partner, Reuters, unpacks this conundrum in more detail.


The Biden administration has been forced to recalibrate their thinking on whether to scrap some tariffs or potentially impose others on Beijing, according to sources familiar with the deliberations.
It has considered a combination of eliminating some tariffs, potential additional tariffs, and expanding a list of tariff exclusions to aid U.S. companies that can only get certain supplies from China.
Additional tariffs would make Chinese imports more expensive for U.S. companies, and subsequently makes products more costly for consumers. However, bringing inflation down is a major goal for Biden ahead of the November mid-term elections.
Politically there is a delicate path to tread, but recent market dynamics may suit US policy makers.

[Webinar] Inflation, Growth and Markets: Hear from the Experts |

Economies around the world are enduring inflationary pressures not experienced in decades. Rising cos

ts triggered by supply chain interruptions and wage demands as economies roared back to life post-COVID were compounded in February by Russia’s invasion of Ukraine, disrupting crucial commodity supplies. Join a panel of expert Reuters editors to discuss the issues and hear from Refinitiv’s Director of Macro and Economics on how to use Workspace and Eikon product enhancements.

How are digital assets used to evade sanctions?
There is a growing concern that criminal networks may seek to circumvent global sanctions through the use of cryptocurrency. Refinitiv is working on promoting a more coordinated global response to financial crime, focusing on protecting the digital asset space. How can we respond to the challenge? >
Everything flows: Green equity funds go red for the first time since COVID meltdown

After a volatile start to July, the FTSE 100 crept up a touch less than 250 points over the month, with other equity markets globally turning upwards in a similar fashion from late June recent lows. At the same time, the yield on the benchmark 10-year gilt was squeezed by about 90 basis points. Fund flows, however, do not reflect this—at least at the most broad-brush asset class level, with redemptions excluding money market vehicles running to £7.9bn.  Find out more about recent asset flow trends >

Breakingviews: D.C. turf war opens crypto regulatory arbitrage 


Cryptocurrency ventures can divide and conquer Washington’s regulatory fiefdoms. The U.S. Federal Reserve staked out its turf this week, telling lenders to notify it if they offer services for bitcoin and its ilk. Other agencies are also wrestling to oversee the $1 trillion market. The scrap provides an opportunity for some industry participants, but it hurts token owners. Read on >

Deep U.S. curve inversion hastens the recession it predicts 

An inverted U.S. Treasury yield curve almost always heralds recession, but the yawning gap between high short-term funding costs and falling long-term borrowing rates may accelerate the economic downturn it presages. Reuters columnist Jamie McGeever looks at the potential impact of an inverted U.S. treasury yield curve.

Refinitiv Corporate Treasury Newsbeat

Refinitiv issues consultation on Tokyo Swap Rate benchmarks |  Refinitiv announced the publication of a consultation paper regarding the Tokyo Swap Rate benchmarks. Refinitiv administers Tokyo Swap Rate, a Japanese yen (JPY) interest rate swap (IRS) benchmark family, which is used in the valuation of swaptions, CMS, structured loans and notes, FRNs and private finance initiatives. Read more here >
Bulgarian Stock Exchange powers sustainability index with Refinitiv ESG metrics |  The Bulgarian Stock Exchange (BSE) announced it has adopted Refinitiv’s Environment, Social and Governance (ESG) metrics to power its sustainability index set to be launched end of 2022 Read more here >
Refinitiv to launch forward looking term rate versions of ARRC recommended fallback rates this September to facilitate industry transition from USD LIBOR |  Refinitiv announces that it intends to launch forward looking term rate versions of its ARRC recommended fallback rates – USD IBOR Cash Fallbacks – in September 2022. This follows the Alternative Reference Rates Committee’s (ARRC) March 2021 announcement that it had selected Refinitiv to publish its recommended fallback rates for cash products and Refinitiv’s November 2021 announcement that it had released production fallback rates based upon various SOFR conventions.  Read more here >
For more data-driven insights in your Inboxsubscribe to the Refinitiv Perspectives weekly newsletter.

Image promoting the Corporate Treasury Data Insights newsletter. Subscribe Now!


RECAP | Cash and Treasury Management Event Copenhagen | By Pieter de Kiewit

06-09-2022 | cashandtreasury.dk | treasuryXL | Pieter de KiewitLinkedIn


Last week, Pieter de Kiewit was Chairman of the Cash & Treasury Management Conference in Copenhagen. Pieter decided to take the effort to share his experience with you.


By Pieter de Kiewit, Chairman of the event

Corporate treasury events come in many shapes and sizes. Earlier this year, I reported on my visit to Mannheim, in a few weeks you can expect a blog about Vienna, in this blog more about Copenhagen. I can already tell you that I liked the format and set-up of this event.

Corporate treasury markets will always be very niche. The event organiser, Insight Events, targeted a mainly Danish-Scandinavian audience. The sessions were all in English and the venue was the beautiful Hotel D’Angleterre in the heart of Copenhagen. It was also a conscious choice to keep the audience small, just under 150 and of high calibre: almost all treasurers, most of them quite senior and well informed. The consequence of this choice is also that there were no parallel sessions, all sessions were attended by the entire audience. During the break one could meet the various treasury service and product providers, including treasuryXL partner Nomentia.

Last year, I was asked to present on “how to get hired for your next treasury position” and had some questions during other sessions. Based on the bond we built, I was asked to be moderator/chairman of this year’s event. I thought it was a great gig, if it was appreciated, you just have to ask others.


The programme consisted of presentations and panel discussions led by Nordea. I was impressed by the level of quality offered. There were two macro-economic presentations, one by the Chief Economist of Nordea, a well-known TV personality in Denmark and the other by a senior director of EKF, the Danish export credit agency. Both gentlemen brought very thorough interesting insights but, given the current global developments, also a gloomy and dark future.

Another highlight was the input on ESG financing where treasurers and senior sustainability experts together informed the audience about the reality of this type of funding making in, at least for me, an inspiring way. In a cleverly constructed format, credit rating and Basel IV developments were linked in a session with the most questions from the audience.

In other, more traditional but also essential and informative sessions, building treasury teams, mergers and career development were on the agenda. And the non-treasury topic was brought up in a very entertaining way about a hacked company that does not want to pay a ransom. Relevant not only for treasurers and definitely food for thought.

Looking back, I see a very successful and high quality event. On a personal note, I always enjoy the international in my work. Me as a Dutchman, extrovert, direct and sometimes unintentionally rude, communicating with civilised, reserved Scandinavians who do not ask too many questions hopefully did not result in not being invited for next year. We shall see…..


Thanks for reading!

Pieter de Kiewit

Get to Know TIS

05-09-2022 | treasuryXL | TIS | LinkedIn |

To give their clients the best treasury, payments, and liquidity management software and support possible, TIS is continually expanding and developing. Download the “Get to Know TIS” Factsheet to view the most recent details about their business and solution portfolio.

Source

Get to Know TIS

Read the factsheet to learn more about TIS. The purpose is to summarize each area of our business in order to educate readers on all the core capabilities, value-added services, and general operational expertise that TIS offers to clients.

This resource also highlights relevant stats, figures, and metrics that demonstrate TIS’ position as a global leader in enterprise payments and liquidity management. For more information about the capabilities that TIS offers or to better understand any aspect of our solution suite, request a private demo with one of our experts by emailing [email protected].


You can find the factsheet here


Managing working capital in challenging times | Attend on December 1st 2022

31-08-2022 | treasuryXL | The Working Capital Forum | LinkedIn |


Are you a Corporate Treasurer? Attend The Working Capital Forum Europe 2022 for free: use code TXL22CG

  • Banks, fintechs, and other solution providers can get 25% off the cost of a ticket using this TreasuryXL code: TXL2225


Mark your calendar for the 1st  of December 2022! The Beurs van Berlage in Amsterdam will open the doors for The Working Capital Forum Europe. This event brings together leaders in treasury, procurement, and payments to share ideas and techniques for better working capital management across supply chains.

That’s never been so important as in these times of rising interest rates, inflation, and supply chain shocks, when managing working capital is everyone’s concern.

From supply chain finance to accurate cash forecasting, solutions for every component of working capital management will be discussed on stage, demonstrated in our information area, and examined in our workshops at the world’s largest specialist working capital and supply chain finance event.

We’re delighted to return to Amsterdam for this one-day live event, with main stage keynote sessions, panel debates, and breakout workshops and demos.

If you’re interested in optimising working capital in your organisation, you need to join us in Amsterdam for the most productive day you’ve had in years.

Among the topics we will be covering are:

  • Cash forecasting and cash visibility
  • Payables finance
  • Receivables finance
  • Optimising receivables – get paid faster
  • Inventory management and inventory finance
  • Supply chain finance
  • ‘Deep tier’ supply chain finance
  • Funding options for trade and supply chain finance
  • Using working capital tools for ESG objectives
  • Credit insurance
  • Disclosure rules on supplier finance
  • Ratings agencies and their view of working capital solution

TO REGISTER AND FIND OUT MORE VISIT:  WORKING CAPITAL FORUM EUROPE 

Visit the Working Capital Forum: https://www.workingcapitalforum.com/

Join our events here: https://www.workingcapitalforum.com/events

Enter the Working Capital and Supply Chain Finance 2022 Awards here: https://www.workingcapitalforum.com/awards.html


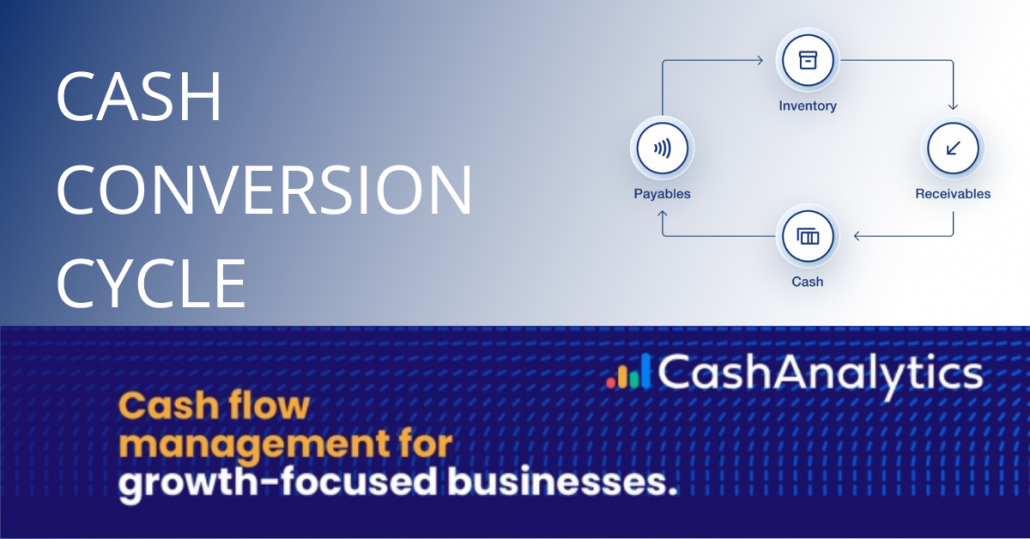
What is a Cash Conversion Cycle?

24-08-2022 | treasuryXL | CashAnalytics | LinkedIn |

Did you know that on treasuryXL you can find information on all relevant treasury topics? One of the concepts you can find information on is the Cash Conversion Cycle.  A business’s cash conversion cycle (CCC) is a measurement of how much time it takes to turn a cash investment in the business into a cash return in the form of sales. CashAnalytics can tell you all about how to calculate your CCC, what makes a good/bad CCC and how to shorten your CCC.

Original source


Find out:

  • How to Calculate Your Cash Conversion Cycle

  • What Is a Good Cash Conversion Cycle?

  • How to Shorten Your Cash Conversion Cycle (Sustainably)

  • Sustainable CCC Improvements Require Reliable Real-Time Data


Read what Cash Conversion Cycle is all about


When Should You Start a Hedge Program?

23-08-2022 | treasuryXL | GTreasury | LinkedIn |

A popular Chinese proverb says “the best time to plant a tree was 20 years ago. The second-best time is now.” This is equally true in the world of hedging.

Source: Hedge Trackers, a GTreasury Company

We’ve seen volatility in currency markets, with the EUR falling 9 percent between Labor Day and Thanksgiving. We’ve seen volatility in commodities, with some commodity prices doubling and tripling and oil prices approaching 10-year highs. And short-term interest rates may quadruple in a year.

Companies that have well-run hedge programs have time to prepare and adjust to these forces. But what if you’ve been waiting for “the best time” or “the right time” to hedge?

Two years ago, we were surprised with a global pandemic – when everything settles down, will it be a good time to start a hedge program? Before we even have a chance to assimilate that, we are now faced with war in Europe. Sanctions, which will almost certainly be followed by more sanctions and more volatility, and which will be followed by what? Are you feeling like you’ve missed the opportunity to start hedging?

It’s never too late to set up a hedge program.

Now, just like last week, last year, and five years ago, the steps are the same.

  • Determine what your objective is. As our own Helen Kane says, “I believe that most hedge programs should take a deep breath, step back and determine what is really the objective…. Are they trying to protect margins? Are they trying to lock in budgeted earnings? Are they smoothing the year-over-year impact of currency into their financials?”
  • Once you know your objective, identify and quantify your exposuresInvestigate the start of the exposure (often not easy to identify) and its end. The answers will be different depending on your hedge objective, and that’s why it’s critical to get that objective determined first. It is expected that you would have different objectives for different exposures.
  • You’re ready to start working on your policy, detailing what exposures will be managed with what strategies/derivatives over what time frame. You may want to consider some flexibility in the policy to systematically take advantage (or not), with clear guidelines generational rate movements – allowing more or less (but not zero) hedging in those times when rates hit 5- or 10-year highs or lows. This provides a framework to contemplate those things that we thought were so rare that we wouldn’t see them in our lifetime. Remember those days?
  • There are other documents that will be necessary. If not addressed directly in your policy, you’ll want a guideline for accounting and an appropriate control structure. You’ll also need to make sure that inception documentation supporting any special hedge accounting is compliant.
  • You’ll need to set up a process for collecting exposures at different stages (anticipated, recognized, impacting earnings, settled).
  • Make sure that you have a good working relationship and legal framework (ISDA) with your counterparties and that you set up a good process for trading and competitive bidding.
  • Of course, trade management and special hedge accounting should not be left to spreadsheets. We’d be happy to introduce you to CapellaFX, which not only is a trade repository but also accumulates your exposure data (existing and anticipated), applies hedge decisions, designates and documents exposures, drives your hedge accounting and provides effectiveness tests. Most importantly, it is user-friendly for both Treasury and Accounting and doesn’t require a derivative specialist to use or implement.

Conclusion

Does all of this seem daunting? It doesn’t have to be. Hedge Trackers can help you with every step. We have the people and the systems to assist your team, or you can offload some or all of the process to us.

Returning to our original question on the best time to plant the tree – or start a hedging program. If you haven’t already done so, recall that the next best time to start is right now.


Harmonisation of FRTB data compliance requirements by local jurisdictions is crucial

09-08-2022 | treasuryXL | Refinitiv | LinkedIn |


Banks face uncertainty over changing responsibilities under the Fundamental Review of the Trading Book (FRTB), but potential jurisdictional divergence on new requirements for data vendors could add greater complexity to the roll-out of these new rules.

Read more

Cash & Treasury Management: Join The World’s Leading Experts in Copenhagen

04-08-2022 | cashandtreasury.dk | treasuryXL | LinkedIn


Featuring Chairman of the event, Pieter de Kiewit – Owner of Treasurer Search


Be a part of the exclusive Cash & Treasury Management Conference on the 1st of September 2022, which will be held in the extraordinary luxury settings at Hotel d’Angleterre in Copenhagen.

Get updated, expand your network, and get inspiration for optimizing your work within the Cash & Treasury Management community.


The international program consists of selected and experienced speakers that have proven success within a certain area of Cash & Treasury as e.g., ESG, digitalization and Cash Management. The conference brings together a selected group of high-level senior treasurers from global organizations. Learn from your international peers and join the exclusive network. The event ensures you a full day of new knowledge and inspiration made for high level Treasurers. You get in-depth with the latest trends, valuable content from recognized speakers and extensive networking opportunities.

Among others, these topics have been selected for this year’s conference:

  • Sustainability financing – experiences one year down the road
  • Proprietary data driven cash flow forecasting model
  • How we integrated Nets Group Treasury in to Nexi Group treasury
  • Experiences from a massive hacking attack
  • A career within Novo Nordisk treasury
  • Macroeconomic trends and predictions


As part of TreasuryXL’s network we offer treasurers 25 % discount.

Sign up now and join us 1 September – Remember to use the code when signing up: TreasuryXL25


Read the program and learn more about participation and sponsorship opportunities: cashandtreasury.dk


Every CFO Needs to Track These 8 Cash Flow KPIs. Here’s why.

03-08-2022 | treasuryXL | CashAnalytics | LinkedIn |

Companies shut their doors for a wide range of reasons — but often, finances force leaders to close their business. Aisling McGrath, Senior Marketing Manager at CashAnalytics, explains to us 8 key performance indicators a CFO needs to use in order to analyze cash flow and minimize financial risks.

Original source


According to CB Insights, 38% of businesses fail because they ran out of cash and were unable to raise new capital. Another article by Formulate shows that previously successful companies fail due to financial factors like lack of funding, mounting debts, huge pension deficits, and more.

With stakes that high, it’s important that you keep track of your company’s cash inflow and outflow. Cash flow KPIs — when evaluated regularly — are a CFO or financial controller’s most powerful measure of underlying market valuation and profitability.

To analyze your cash flow and minimize financial risks, use these eight key performance indicators.

1. Operating Cash Flow

What Is Operating Cash Flow?

Operating cash flow (OCF) is the cash your business generates from its day-to-day operations, excluding investing and financing activity. This financial KPI shows you the number of times your company is able to pay up debt in any given timeframe.

Also known as cash from operating activities (CFO) or net cash from operating activities, operating cash flow is typically the first section shown in a cash flow statement.

How to Calculate Operating Cash Flow

Operating Income + Depreciation – Taxes + Change in Working Capital = Operating Cash Flow

Pros

Cash from operating activities is a key indicator of your company’s ability to generate cash. By monitoring this financial metric, you’ll identify income and expense sources — then double down on generating and maintaining the cash you need for a smooth business operation.

Operating cash flow is also a measure of financial success because it shows whether your core business operations are booming, and it directly influences liquidity.

Cons

Operating cash flow focuses only on basic business activities like providing services or manufacturing and selling products. The metric doesn’t account for investment revenue, expenses, or long-term capital expenditures, so it gives an incomplete picture of the cash status.

Another downside to this cash flow KPI is that it does not assess your company’s true liquidity position. Operating cash flow does not provide long-term liquidity visibility. You can only tell your firm’s cash balance per day.

2. Free Cash Flow

What Is Free Cash Flow?

Free cash flow (FCF) is the money your company has left after deducting operating expenses, capital expenditure, and major investments. The last one or two sections of cash flow statements often cover FCF and its different variations.

How to Calculate Free Cash Flow

Operating Cash Flow – Capital Expenditures = Free Cash Flow

Pros

Free cash flow gives a clear picture — to your finance team, business owners, investors, and creditors — of cash that you can mobilise at any given time. You’ll know if your company is able to:

  • Pay monthly dues (debt interest and investor dividends).
  • Carry out expansion activities like buying or setting up a new plant, introducing a new product line, hiring more staff, and more.
  • Go after short-term investments like money market accounts, treasury bills, certificates of deposits, and others.
  • Collect fresh loans or lines of credit.
  • Attract new investors or partners.
  • Influence favourable stock pricing.

Cons

While free cash flow is a good measure of profitability, it shouldn’t be used as a standalone indicator.

High free cash flow doesn’t always mean good financial standing — it could be an indicator of inadequate investments in business growth. At the same time, low free cash flow could be a symptom of growth and expansion. For accuracy, always consider free cash flow alongside other KPIs like operating cash flow and cash conversion cycle.

Capital expenditure changes from year to year and across industries. To get a good picture of financial stability over time, observe free cash flow for at least two years. Beyond that, you should also keep in mind industry realities and standards like the average profitability or break-even window.

3. Cash Flow Per Share

What Is Cash Flow Per Share?

Cash flow per share — also called free cash flow to the firm (FCFF) — is the amount of free cash flow on each outstanding share of your company’s stock. This metric appears as a ratio and shows a company’s earnings per share (EPS) less taxes, depreciation, and amortization.

When you have a high cash flow per share, it means your share value will be potentially high. But if your cash flow per share is low, the odds are that share value and earnings will remain down.

How to Calculate Cash Flow Per Share
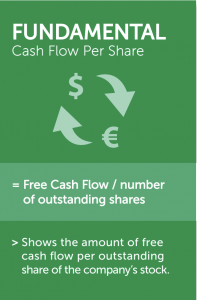
cash flow per share

Pros

Financial analysts prefer cash flow per share to earnings per share because the former is difficult to manipulate. Cash flow per share accounts for irregular expenses — like depreciation and amortisation — and excludes non-cash earnings like pending accounts receivables.

As opposed to earnings per share, cash flow per share makes it harder for bad actors to alter your company’s cash flow numbers. Because of this reality, cash flow per share gives a more accurate picture of your business’s financial strength and business model vitality. This cash flow KPI also lets you determine your company’s ability to pay dividends and service other expenses.

Cons

One limitation of using cash flow per share is that it doesn’t show your firm’s net income because the calculation doesn’t include non-cash items. These items can only be found in the income statement or balance sheet. For proper analysis, look at your cash flow per share, income statement, and balance sheet together.

4. Cash Flow Yield

What Is Cash Flow Yield?

Cash flow yield (also called free cash flow yield) is a financial ratio that compares your company’s free cash flow to its current share value.

How to Calculate Cash Flow Yield
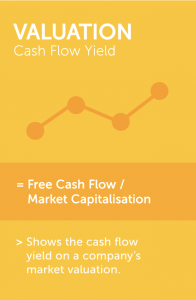
cash flow yield

Pros

Cash flow yield gives a clear picture of your firm’s ability to access cash quickly. From a cash flow yield calculation, you can tell whether your company is capable of a debt repayment or dividend payment. This metric is particularly key for investors because they always want to know how well their funds are working for them.

When investors are determining whether or not to put money in a company, they may want to see up to 10 years of cash flow yield data and compare it to a treasury note covering the same period. This comparison will help investors calculate the firm’s valuation or determine when a buyout will start generating profit. If cash flow yield is significantly lower than the treasury yield, the company will be considered a poor investment.

Cons

While cash flow yield is a great way to measure your company’s financial position, you should not fully depend on it. This KPI is only truly beneficial when you combine it with a collection of other indicators like cash flow margin or return on invested capital.

5. Cash Conversion Cycle

What Is Cash Conversion Cycle?

Cash conversion cycle (also called cash cycle or net operating cycle) is a measure of how quickly your company can turn resources — outstanding sales and inventory — into cash. The cash conversion cycle accounts for the average number of days it takes your company to collect receivables and sell off inventory — plus the amount of time you have to pay bills without attracting late fees.

How to Calculate Cash Conversion Cycle
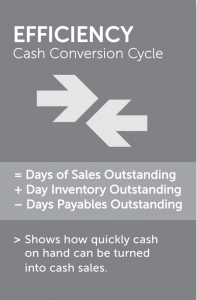
cash conversion cycle

Pros

Because the cash conversion cycle reflects how quickly your firm is able to turn cash investments into returns, this metric helps you save money. You’ll be able to plan around when you expect cash inflow, so you can meet your financial obligations and avoid late payment penalties.

With a short cash conversion cycle, you can convince vendors to let you defer payment for goods. You’ll also gain the confidence to sell inventory on credit.

Cons

The cash conversion cycle is a good measure of your company’s operational and management efficiency — but it only applies to businesses with inventories.

Also, the cash conversion cycle doesn’t provide in-depth financial insight per time. But if you look at the cycle’s trend over time and in comparison with similar companies, you can:

  • Give proper reports to management and investors.
  • Work on improving the cycle time.

New investors tend to go for companies with a low cash conversion cycle because they make quicker returns. So if an investor has to choose between two companies with similar returns on current assets and shareholder equity, yours will be the best bet.

6. Cash Flow Margin

What Is Cash Flow Margin?

Cash flow margin is a ratio that shows how well your company converts its sales to cash. This ratio tells you the difference between money that has come in from sales and funds you’re still expecting — all of which make up your revenue. Because the cash flow margin compares actual money transfers to pending transactions, it’s a great measure of total revenue quality.

Say you booked a huge sale that boosted revenue but are having a hard time collecting the cash. Your revenue is up, but your cash flow margin isn’t.

How to Calculate Cash Flow Margin

Free Cash Flow/ Revenue % = Cash Flow Margin
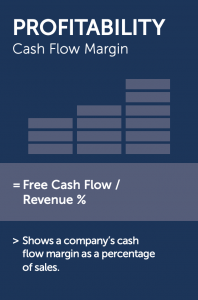
cash flow margin

Pros

Cash flow margin reflects the actual amount of cash you have from sales, so it is a good measure of real-time profitability. This ratio also shows operational efficiency by presenting how well your firm collects accounts receivables.

Cons

A short-term cash flow margin is prone to inaccuracy. Say your company delays accounts payables to retain cash within the business. A one-year cash flow margin analysis will be off the mark because the cash position has been unduly influenced.

But a company can only defer payments for as long as its line of credit lasts before penalties start to apply. After some time — weeks, months, or years — the firm will need to pay its current liabilities. For a more accurate perspective, stakeholders — investors, management, or creditors — should consider period-to-period cash flow margins

7. Cash Flow Return on Invested Capital

What Is Cash Flow Return on Invested Capital?

Cash flow return on invested capital (CROIC) is the amount of money your company makes as a proportion of total capital employed.

How to Calculate Cash Flow Return on Invested Capital

Free Cash Flow/Total Capital% = Cash Flow Return on Invested Capital
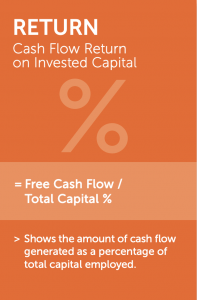
cash flow return

Pros

Cash flow return on invested capital is a great profitability gauge because it calculates returns against funds employed to generate it. To make returns from investing, you need to create and follow a solid cash management plan. So a positive cash flow return on invested capital shows the strength of your capital investment strategy.

A high cash flow return on invested capital is great, but if your returns aren’t high in the first year or two, it’s not too much of a concern. If your returns consistently decline over multiple financial periods, though, it’s a likely sign of poor cash flow management.

Cons

Capital return on invested capital does not show which business activities are generating what value. This reality makes it hard to accurately monitor and influence cash inflows — especially one-off events like net income from a land or business division sale.

8. Net Debt to Free Cash Flow

What Is Net Debt to Free Cash Flow?

Net debt to free cash flow is a measure of how many years of free cash flow you’d need to repay your current outstanding debt.

How to Calculate Net Debt to Free Cash Flow

Net Debt/ Free Cash Flow = Net Debt to Free Cash Flow
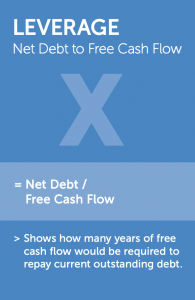
Pros

Net debt to free cash flow shows your ability to pay off debt quickly, so it’s a great indicator of financial stability (or lack of it.)

Cons

Typically, needing a few instead of many years to pay off outstanding debt is a sign of economic resilience because it means either of the following:

  • You owe very little.
  • Your cash conversion cycle is short.

But sometimes, too little debt could be a red flag because it means your firm is not investing enough in ongoing growth to remain competitive.

Beyond Tracking Cash Flow KPIs, Use CashAnalytics for Quick Scenario Analysis

Cash flow KPI tracking allows you to regularly gauge your business’ financial health and minimise risk. But even with this monitoring, the unexpected can happen — like a pandemic or recession — and destabilise your business.

Prepare for potential volatility with scenario planning. With CashAnalytics’ robust suite of analytics features, you can quickly access financial data — and conduct scenario analysis. Book a free demo to see how our tool helps you track and predict cash flows.


Treasurers Get Strategic About Hedging Programs as Interest Rates Keep Rising

02-08-2022 | treasuryXL | GTreasury | LinkedIn |

The current interest rate landscape (read: rates going up for the foreseeable future) is spurring treasurers and the office of the CFO to implement rate hedging strategies at a faster clip. For many organizations, hedge programs are a new initiative—and it can take some understanding to know what they do and what to look for from companies that offer them.


Farah Lotia, the Director of Interest Rate and Quantitative Analytics at Hedge Trackers (a GTreasury company), discusses what interest rate hedge programs are, the ROI benefit they deliver treasures, how to get started with them, and why there has never been a more advantageous time to implement them.