Constructing a yield curve for local authority loans
| 22-06-2016 | Lionel Pavey |
 So far in this series we have constructed yield curves based on Interest Rate Swaps. This route was chosen as Swaps provide the benchmark for pricing many loan products. Let us look at constructing a yield curve for local authority loans. Yet again, the choice has been made for a product where prices are published on a daily basis.
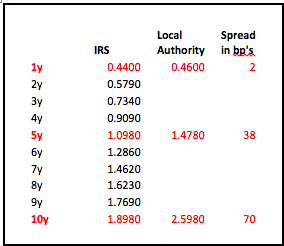
The data that is published is not as comprehensive as that for Swaps but, using the procedures shown before, we are still able to build a curve. Only 3 data points were published – 1 year, 5 year and 10 year. It is thus possible to build a 10 year curve – the data is as follows:

Going back to the principles employed when building the IRS curve we shall make a first attempt by using linear interpolation of the spreads – a reasonably obvious approach. I shall save you all the calculations and simply say that this approach leads to an implied 1 year constant maturity curve that is not completely smooth – there is a peak in the period starting in 4 years.
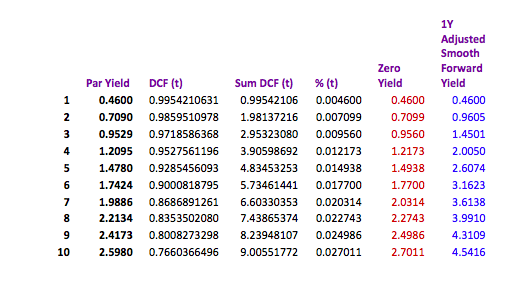
Obviously you could manually alter the prices to achieve a better curve or make use of a curve building model like Nelson & Siegel. Personal experience has resulted in my preference being to calculate the ratio between the local authority rates and the swap rates and allowing the model to find a best fit. Ratios are generally less volatile than the input rates allowing for a better fit. Eventually an implied local authority curve can be built as shown below:

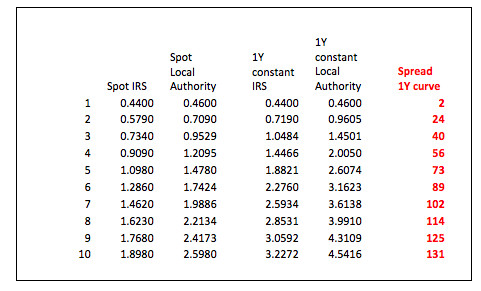
As previously shown the spread is also monotonic – constantly rising. Consider the implications if we know that a 10 year loan has a spread of 70 basis points over swaps whilst the 1 year loan has a spread of only 2 basis points over swaps.
A 10 year spread can also be defined as the weighted average of all the underlying 1 year constant maturities, so let us investigate how this works in this model:

A 10 year spread of 70 basis points starts with a spread of 2 basis points in the 1st year rising in the 10th year to 131 basis points when compared to the underlying implied 1 year constant swap curve. As a treasurer it is important to know how rates are constructed and determine for yourself what the best approach is to your funding needs. Where do you think rates will be in the future, what will the spreads be, borrow for 10 years or borrow for 5 years and renegotiate? A fixed spread is therefore very advantageous for the lender.
No one knows the future but the ability to calculate the implied future price can assist in making decisions now regarding the future. Long dated fixed loans are difficult to break open leading to potential opportunity losses. Bullet loans are the easiest to price, but by focusing only on the cash flows and not their individual time buckets it is possible that the best decisions are not always made. Linear loans are less transparent when pricing but, yet again, a different time approach can be used to make the process simpler. Rollercoaster loans used in construction and infrastructure projects are the most opaque but can also be viewed in a different light if approached in another manner.
Next – Opportunity loss/profit. If I could turn back time or see into the future

Cash Management and Treasury Specialist – Flex Treasurer


