Talk of the day: German Bund Yield Below 0%

| 15-06-2016 | Udo Rademakers, Rob Söentken, Douwe Dijkstra & Lionel Pavey |

german bund yield below 0


For the first time ever the German bund yield hit negative territory. The ‘Deutsche Welle’ writes: “With the prospect of Britain leaving the European Union looming ever larger ahead of referendum in 9 days, global investors are increasingly fleeing to safe havens such as German debt and Japenese currency. As a result, the yield on Germany’s benchmark 10-year debt fell into negative territory for the first time in its history on Tuesday. ” (DW.com) We asked some of our experts to give their opinion on this news:


Udo Rademakers
“Billions of Euro´s are invested into sovereign debt, even if meanwhile investors need to pay for this. German yield prices can meanwhile compete with Japan and Swiss rates (all below 0). The mainstream media explains this development as “concerns about the economic and political risks of a Brexit” and “concerns about the state of global growth”. However, the longer term trend since the 1980´s has been downwards and we now see a kind of (last?) acceleration in price.

Knowing the challenges Europe (and Germany) is facing, I think it is a matter of time before we could expect a spike in the rates again….. .I would place my bet in other markets.

Every trend is coming to an end…….”

Rob Söentken                                                                                                   
“Not even a month ago markets were discounting the impact of the Brexit referendum. Now in a matter of weeks the odds have swung back from around 25% in favor of leaving to 42%. The increased media attention and figures (true or false) being thrown around are making voters run to register to vote. Apparently it’s mostly younger voters, who tend to be more in favor of staying. It is said that a turnup above 60% is favorable to the ‘remain’ vote. Still both camps are becoming more and more committed.

The downside for GBP vs EUR is probably the biggest risk. If the UK leaves the EUR, UK equities may dip sharply, but will likely recover because of the prospect of more independent monetary and economic policy. Interest rates will probably start rising to incorporate the increased independence risks. But the GBP as a currency may dip an absolute 10% or more, anticipating asset sales from foreign investors. Investors will fear the UK will become like Italy and France in the past: a country that needs to devalue its currency on a regular basis to offset internal rigidities and inefficiencies.”
                 Douwe Dijkstradouwedijkstrarond
“Who would have thought this a few years ago, the interest rate on 10- year German government bonds below zero percent. For some time we hear our banks and advisors recommending to fix our interest rate exposure because its “now or never”.

However, anyone who has fixed already acted too early. For one of my clients I’m busy to Blend & Extend their current IRS contracts, fixing the interest rate for 7 years. Afterwards too early? Nobody knows. I think my client will have no regrets rather ” sooner than later”!”

Lionel Pavey

lionelrond
“Possible reasons:

  • Flight to quality – investors looking to place their money in a safe place
  • Brexit referendum – polls suggest chance of exit greater than ever leading to uncertainty
  • Quantitative easing – ECB policy of buying government bonds pushes bond prices up and decreases the yield

More on this topic in my article which will be published on Friday.”

What’s your opinion on this news? Let us know in the comment section below.

B2B Fintech: Payments, Supply Chain Finance & E-Invoicing Guide 2016

| 14-06-2016 | treasuryXL |

The B2B Fintech: Payments, Supply Chain Finance & E-Invoicing Guide 2016 has been released by the Paypers. The guide is a map of the complex and dynamic world of Fintech. Carefully documented, the guide keeps readers informed about the latest developments and opportunities in B2B payments, SCF, and e-invoicing.

The guide offers valuable information for industry professionals, associations, analysts, industry solutions providers and Fintech enthusiasts via a thoughtfully structured journey into the dynamic world of B2B payments, supply chain finance and e-invoicing. Also, the guide is completed by a detailed online company profiles database with advanced search functionality.

Highlights of the report:

  • the future of banking innovation from two leading banks (Deutsche Bank, UniCredit);
  • the most interesting use cases for blockchain in B2B payments and supply chain finance (Aite Group, Innopay, Orchard Finance);
  • how to reinvent the correspondent banking model as we know it today (SWIFT);
  • the challenges for international payments & financing projects (sharedserviceslink, KAE, NAPCP, Token, Future Asia Ventures, INTIX);
  • supply chain finance: a significant new proposition in the financing of trade and supply chains, but what’s next (ICC Banking Commission, Windesheim, Magnus Lind – The Talent Show, Anita Gerrits);
  • the steps needed for successful open & cross-border e-invoicing (Comarch EDI, Fraunhofer Institute, simplerinvoicing);
  • the regulation helps or hinders innovation and growth: up to date insights on PSD2, Directive 2014/55/EU, Prompt Payment Code, etc. (Brendan Jones, EESPA, Asset Based Finance Association, IAAF)

The guide opens an eye on the unique factors that puts the scene in a forever changing game, with new actors, new rules and impediments that require constant innovation and original ideas. The inner architecture of the guide follows closely the most important issues of the moment, trends and developments in payments & financing.B2B payments Report 2016_Cover_The Paypers
Don’t miss out the most comprehensive and up-to-date overview on the global B2B Fintech: payments, supply chain finance and e-invoicing ecosystem. Download your free copy of the Guide here.

Share your thoughts on the topics developed in the B2B Fintech: Payments, Supply Chain Finance & E-invoicing Guide 2016 by commenting on this article or maybe share your thoughts in an article about one of the topics.


Zero Coupon Yields and implied Forward Yields

| 13-06-2016 | Lionel Pavey |


Having constructed our 20 year yield curve with both observable data and discovered data in my previous article,we are now in possession of 3 sets of data:

  1. Spot par rates
  2. Spot zero coupon rates
  3. Discounted Cash Flow factors (DCF)

The most important of these, for calculation purposes, is DCF.

Present Value

The discounted present value of a future cash flow can be calculated by dividing the future value by the DCF. It therefore follows that a series of future cash flows can also be discounted to a single net present value.

Implied Forward Rates

The original yield curve showed annual spot rates for a period of 20 years. Using DCF it is possible to construct similar curves but with forward start dates – a curve starting in 1 year, 2 years, 3 years etc. When building these curves the “implied” forward rate will actually be a zero coupon rate and not a par rate. Converting the zero rates to par rates can be achieved by using Excel Solver – a very useful tool but great care must be taken as Solver gives an answer but shows no formula.

So, how do we calculate an implied forward rate?

Let us assume that we wished to find a rate with a duration of 4 years, starting 5 years forward.
To achieve that, we need both the 5 year DCF and the 9 year DCF

The previous constructed curve yields the following values –

5Y DCF                    =               0.9464924176

9Y DCF                    =               0.8508986778

((.9464924176/.8508986778)^(1/4)-1)*100     =  2.6975% implied 4 year rate starting in 5 years

As stated, this is the implied zero coupon rate – the implied par rate is 2.6887%

All forward rates are purely implied rates – a true quoted rate would always be different for various reasons –

  1. Spread between bid and offer
  2. Yield curve constructed with specific data
  3. Sentiment of the trader
  4. Possible exposure already in the banks’ books

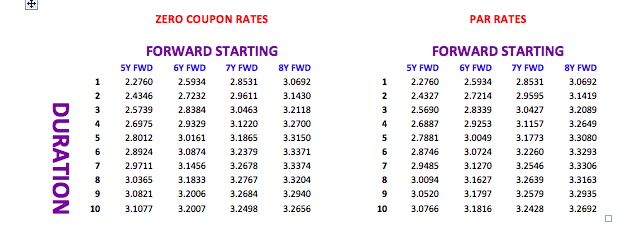
Here is a small snapshot of both implied rates and par rates built with the original curve.

parrates complied rates

When I discussed building the original yield curve, different ways of interpolation were tried. I would now like to show how small differences in yields in a spot curve can lead to significant differences in a forward curve.

Let us look at a duration of 5 years starting 10 years in the future and compare the linear interpolation with the smooth adjusted curve. Assume that the instrument to be priced is a linear instrument – equal repayments of principal every year.

I have built both curves using the same layout and formulae throughout with the exception of the input rates in the missing periods.

The linear rate is 3.276%; the smooth adjusted rate is 3.416% – a difference of 14 basis points or about 4% of the smooth rate. In a market where the normal bid/offer spread is about 3 or 4 basis point, this represents a significant difference/anomaly.

I regularly hear people say that when they need to purchase a financial instrument that they get at least 2 quotes – this is all very well but does not stop a treasurer from first ascertaining what the correct price should be before getting a quote. If banks know that, as a treasurer, you can not calculate the theoretical price this allows them to move the price away from the implied to a price that is more advantageous to them and their trading book! A dedicated financial data vendor system can make life easier, but it is not impossible to calculate a price without these resources!


Next – Spreads; their use and the hidden extra costs

First two articles on building a yield curve:
1. Yield Curves (term structure of interest rates) – filling in the blanks
2. Yield Curves (term structure of interest rates) – filling in the blanks part II


Lionel Pavey


Lionel Pavey

Treasurer


McKinsey beats Warren Buffett

| 10-06-2016 | Victor Macrae |

mcckinseywarrenbuffetAccording to investigations made by the Financial Times, McKinsey Investment Office (MIO), a formerly unknown investment daughter of the top tier strategy consulting firm, has shown a stunning performance over a long period of time. MIO holds $9.5 billion in assets from current and former McKinsey partners, half of which is invested for pension plans, the other half for wealth management. MIO acts like a hedge fund and its policy is to generate equity-like returns over a longer period of time, however with lower risk.

Over the last twenty-five years MIO’s top fund achieved positive returns every year except for the year 2008, in the middle of the financial crisis when most were losing out! According to Hedge Fund Research, the average similar fund lost money in five years over the same period. I guess even Warren Buffett would be pleased with these results. By the way, in 2014 the top fund generated a 14 per cent return against a 3 per cent average return for hedge funds.

MIO was set up thirty years ago and its existence was until recently only known to a small circle of McKinsey partners. Its investment activities are set apart from McKinsey’s consulting business. MIO does not invest directly in quoted securities, but uses external hedge funds and private equity funds, which are considered alternative investments. This alternative asset class generally performs well over a longer period of time and it is not exposed to market volatility such as Buffett’s Berkshire Hathaway shares.

Now that MIO’s ‘cover is blown’ and if it survives the scrutiny of regulators regarding the question whether there is a conflict of interest due to possible information advantages, I suggest that MIO becomes an investment fund open to the public. I would definitely consider investing myself. What do you think?

Victor Macrae


Victor Macrae

Owner of Macrae Finance


FX Global Code of Conduct

| 09-06-2016 | Simon Knappstein |


Last month the BIS published the first phase of the FX Global Code. The final version is planned for completion by May 2017. What is this Global Code and what is the BIS trying to achieve by the establishment of this Code?


Recent history

In the wake of the Libor Scandal a similar rate rigging scandal emerged in the FX market. This related to fraudulent actions around the fixing process of FX Benchmarks. In 2013 the Financial Stability Board commissioned a working group to firstly analyse the structure of the FX Market and the incentives that might promote inappropriate trading activity around a benchmark fixing, and then come up with some potential remedies to address the problems found.

In September 2014 a report was published by the FSB containing 15 recommendations to reform the FX Benchmark process. A number of these recommendations concerned market conduct, specifically related to the fixing process.  To further restore trust in the foreign exchange market and make this market function as effectively and efficiently as possible the BIS commissioned a working group to facilitate the establishment of a single global code of conduct for the FX Market and to come up with mechanisms to promote greater adherence to the code. The first phase of this global code is now published and I will share some observations with you.

What is the Global Code?

The Global Code is a set of global principles, not rules as rules are easier to arbitrage than principles. It is meant to provide a common set of guidelines to promote the integrity and effective functioning of the wholesale FX Market, i.e. a robust, fair, liquid, open, and appropriately transparent market

Unlike for instance the Model Code by the ACI Forex, which is only intended for the sell side and more rule based, this Global Code is developed by a partnership between Central Banks and Market Participants from both sell- and buy-side globally.

The Global Code is organised around six leading principles:

·      Ethics

·      Governance

·      Information Sharing

·      Execution

·      Risk Management and Compliance

·      Confirmation and Settlement Processes

Furthermore it is emphasized that this Global Code does not supplant the applicable laws and regulations for the relevant jurisdictions. It should serve as a reference when conducting business in the FX Market.

So far, so good.

The good thing in this Global Code is that it applies to all organisations and persons active in the wholesale FX Market globally and thus creates a level playing field. The more cynical observer could argue that codes of conduct are around for decades and that these have not been very successful in preventing scandals.

Obviously, thinking of myself as an ethical and honest ex-salesperson and trader, most of these principles are a no-brainer. There is only one principle and related good practices that leaves me a bit puzzled, and that concerns Execution, sub-principle 5: The Mark Up applied to Client transactions by Market Participants acting as Principal should be fair and reasonable. Sounds fair enough, but in a competitive world with Clients comparing quoted prices and trading the most advantageous price to them, hasn’t mark-up already ceased to exist? So what is fair and reasonable about zero mark-up? Or shouldn’t Clients trade the most advantageous?

I wonder, dear reader, what your thoughts are on this?

Reference:
Speech by Mr Guy Debelle, Assistant Governor (Financial Markets) of the Reserve Bank of Australia, at the FX Week Europe conference, London, 25 November 2015.
FX Global Code: May 2016 update


Simon Knappstein - editor treasuryXL


Simon Knappstein

Owner of FX Prospect

How to improve Cash Awareness without targets

| 08-06-2016 | Olivier Werlingshoff |

cashawarenessMany CFO’s and Financial Managers would like to improve the cash awareness inside their companies. The most obvious action is to set up financial targets but how could a change of mindset be reached without new targets? One way is to see cash awareness as a product and to try to sell this product inside the company.

If cash awareness is a product; what are the benefits of this product, why would someone like to buy this new product? In fact, you would have to develop a marketing approach and analyze some of the marketing P’s. I will give you some examples:

Product:

Try to translate Cash Awareness into a product. You could use the term “Cash is King” and find an appropriate symbol or picture for it.

The second step is to enumerate the benefits of cash awareness for the company. One of the benefits is looking at different business processes from a cash point of view. Those processes could probably be improved in a way where liquidities could be released from the company in a faster way.

For example: if you send the invoice by mail the same day you receive the order from your client, you will receive the money faster.

Promotion:

When you know how to make Cash Awareness visible, you have to work on the promotion of it. To give you a few ideas: the first thing I did was getting a ‘Cash King cup’. Every three months I gave the Cup, with his or her name on it, to the colleague with the best idea on how to improve the release of liquidities. I made a picture of him or her with the Cash King cup and mailed it inside the company and put it on the intranet.

To ensure everybody was there when the Cup was awarded, posters were hang and (senior) managers were invited to come to the event. Encourage managers to come by inviting some directors of the company and ask them to give a presentation!

During the event you can give an update of all the ideas you received from colleagues to improve processes and what the financial benefits are of those ideas. To ensure the idea will be implemented you have to make sure the colleague is responsible for his or her idea and try to get the support from the management so it could be implemented. Be aware that without their support it would be difficult to implement the idea!

Positioning:

A third P is the P of Positioning. Develop a habit of constantly looking at the positioning of the product “Cash Awareness” in the company. Think and check how your colleagues think and talk about Cash Awareness when you are not in. You could do this by “walking around” and listening.

Once you have developed your marketing strategy, you should use the “P formula” to continually evaluate and re-evaluate your activities.

Olivier Werlingshoff - editor treasuryXL


Olivier Werlingshoff

Owner of WERFIAD


Van Blueprint tot werkend ERP systeem

| 06-06-2016 | Kasja Reinders |

Op 26 mei jongstleden was ik uitgenodigd om de door De Kiewit Treasurer Search en treasuryXL gefaciliteerde workshop; Treasury Systems – het waarom en hoe (niet) van Treasury & Banking Software bij te wonen. De sprekers brachten interessante onderwerpen aan met goede punten die niet vergeten mochten worden tijdens het implementeren van een ERP/TMS systeem. Hierop werd interactief gereageerd door de aanwezigen. Ik miste echter één belangrijk onderdeel; de Blueprint. Daarom besloot ik hier een artikel aan te wijden.

Van Blue Print tot werkend ERP Systeem.

Er wordt door bedrijven dikwijls te licht gedacht over het aanschaffen van een ERP/TMS systeem. De software bedrijven worden benaderd en mogen hun product presenteren. De systemen zien er goed uit en kunnen je de mooiste rapportages en dashboards laten zien. Door het enthousiasme van deze eerste aanblik vergeet men vaak de essentie van ‘het waarom en waarvoor’ van de implementatie van het ERP/TMS systeem.

Daarom is het belangrijk om een Blueprint te gaan uitwerken, met daarin alle voorwaarden waaraan een systeem moet voldoen, wat het moet kunnen van implementatie tot GL accounts. Een goed uitgedachte Blueprint wordt vaak onderschat door bedrijven en dat kan nadelige gevolgen hebben.

Wanneer je een RFP (Request voor Proposal) plaatst bij software bedrijven van TMS systemen en een aantal van hen uitnodigt om uit te zoeken welk systeem het beste bij jouw bedrijf past, wil het nog wel eens voorkomen dat er een presentatie volgt over de fantastische features en de talloze mogelijkheden van het desbetreffende systeem. Dit klinkt allemaal erg mooi en verleidelijk, maar leidt er vaak toe dat je vergeet waarom je dit systeem op de eerste plaatst wilde aanschaffen.

In een RFP is dit meestal al omschreven, toch is het belangrijk om een Blueprint te maken met daarin wat je verwacht van een systeem; Welke features heb je nodig? Welke rapportages wil je draaien? Denk aan cash flow forecasting, posities, KPI’s, verwerking van informatie zoals leningen, FX etc., betalingsverkeer, accounting en interfaces met andere systemen zoals Bloomberg, banken etc.
Een Blueprint helpt je om focus te houden en geen belangrijke punten te vergeten tijdens het kiezen van een TMS systeem.

Een probleem waar men zonder Blueprint vaak tegen aan loopt, is dat men halverwege het implementeren erachter komt dat het systeem toch net niet de functies heeft die je vooraf in gedachte had, dat je bepaalde essentiële rapportages niet eens kunt draaien. Om deze teleurstelling te voorkomen is het opzetten van een goede Blueprint noodzakelijk. Kun je dit niet zelf? Roep dan de hulp in van een bedrijf dat gespecialiseerd is in het opzetten van Blueprints en implementeren van ERP/TMS systemen. Deze bedrijven hebben de benodigde ervaring om tot een succesvolle implementatie te komen.


Kasja ReindersKasja Reinders – Treasury/Cash manager

[button url=”http://www.treasuryxl.com/community/experts/kasja-reinders/” text=”View expert profile” size=”small” type=”primary” icon=”” external=”1″]


Yield Curves (term structure of interest rates) – filling in the blanks part II

| 03-06-2016 | Lionel Pavey |

Most treasurers do not have access to a dedicated financial data vendor (Bloomberg, Reuters) but are regularly faced with having to discover prices related to yield curves. There are websites that can provide us with relevant data, but these are normally a snapshot and not comprehensive – the data series is incomplete. It is therefore up to the treasurer to complete the series by filling in the blanks. In my previous article I went over the first approach. Today I’ll talk about the second approach.

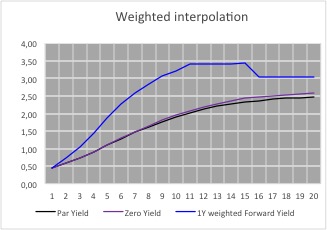
A second approach would be to apply a weighting to the known periods of the par curve and to average the difference out over the missing periods.

grafiek1_part2

Schermafbeelding 2016-06-02 om 13.49.46

This leads to 1 year constant maturity rates that are almost equal in value for all the periods between 2 known periods. Whilst these forward rates are also not correct they at least supply us with a visual indicator as to the general shape of the forward yield curve – the 1 year constant maturity rates

reach their zenith between years 12 and 14; after that point they then start to decrease.

Futhermore, taking into consideration the yield curve as shown in the graph, we can make the following conclusions about the 1 year curve:-

  • 11 year rate must be higher than the linear interpolated rate but lower than the weighted interpolated rate
  • 13 year rate must be higher than the weighted interpolated rate
  • 15 year rate must be lower than the linear interpolated rate and lower than the weighted interpolated rate
  • 16 year rate must be higher than the linear interpolated rate and higher than the weighted interpolated rate
  • 20 year rate must be lower than the linear interpolated rate and lower than the weighted interpolated rate
  • The implied forward 1 year constant maturity curve must be smooth and monotonic.

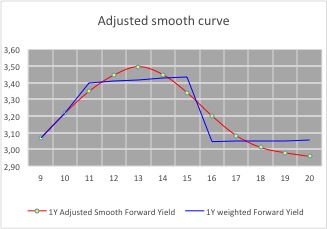
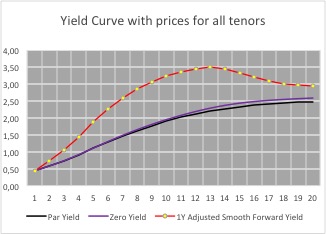
On the basis of these restraints a par curve can be built that leads to the following forward curve.

grafiek2_part2Schermafbeelding 2016-06-02 om 13.50.01

The rates for the missing periods have been calculated manually whilst adhering to the conditions mentioned before– there are formulae which would allow rates to be discovered (Cubic spline, Nelson Siegel etc.) – but these rely on random variables and I have yet to see anyone quote and trade prices based solely on a mathematical formulae.

Visually, the 1 year curve meets all the criteria for the construction of a yield curve, together with the underlying par and zero yield curves.

grafiek3_part2


To ascertain that the rates are correct, discount all the cash flows of the par yield for the given maturity – they should equal 100.

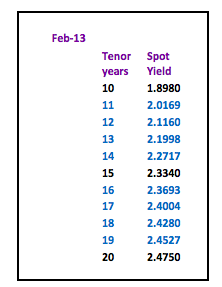
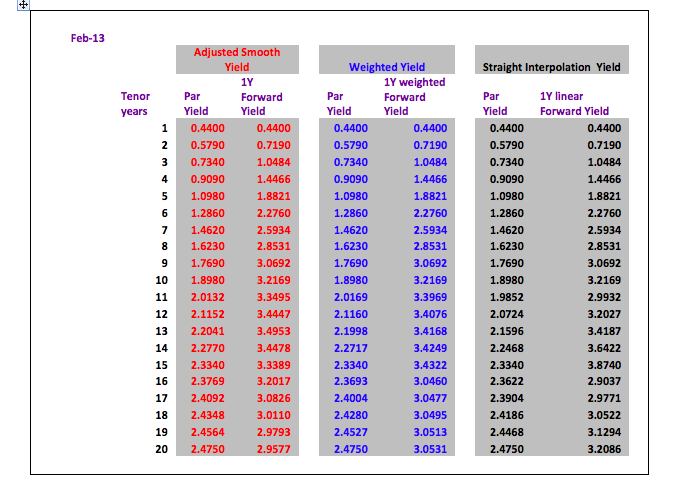
Here is an overview of all the implied 1 year rates using the different methods to construct the yield curve.

Conclusion:

For a quick calculation a straight line interpolation is acceptable with the warning that with a normal positive yield curve the real prices will be higher than the prices calculated by straight line interpolation. For a negative yield curve this would be reversed – real prices lower than interpolated prices.

The average difference between the par yield prices of the adjusted smooth yield and the straight interpolation yield are only 2.5 basis points. However, this difference is magnified when looking at a 1 year forward yield curve where the average difference is 22.5 basis points per period with a maximum of 53.5 basis points.

Next – Zero Coupon Yields and implied Forward Yields

Would you like to read part one of this article?
– Yield Curves (term structure of interest rates) – filling in the blanks


Lionel Pavey


Lionel Pavey

Treasurer


Workshop: Treasury Systems – het waarom en hoe (niet) van Treasury & Banking Software

| 02-06-2016 | treasuryXL


workshop Financial SystemsOp 26-05-2016 waren treasuryXL en Treasurer Search aanwezig op Financial Systems. Naast dat we een stand op de beursvloer hadden, hebben we ook een invitation only sessie georganiseerd: Treasury Systems – het waarom en hoe (niet) van Treasury & Banking Software. Hiervoor hebben we vier interim managers uitgenodigd die elk hun eigen gekozen topics kwamen pitchen. De deelnemers van de workshop waren vrij om vragen te stellen en aan te vullen waar nodig. Het resultaat was een geslaagde en interactieve sessie waaruit we ook voor treasuryXL inspiratie konden putten.

Op voorhand hebben we een aantal doelen gesteld voor deze sessie:

  • Ontwikkelingen op het snijvlak Treasury & Financial Systems doornemen
  • Voor leken: overview & duiding
  • Voor experts: verdere verdieping en bruggen slaan
  • Voor treasuryXL: inventarisatie informatiebehoefte
  • Voor allen: bepalen met wie je mogelijk volgende stappen wilt zetten

De vier interim managers aan het woord

Hieronder volgt een korte samenvatting van de presentaties van de vier interim managers met (indien aanwezig) reacties uit de zaal.

Erik Teiken

Erik TeikenAccounting in je TMS – zijn er voordelen?
Een TMS heeft vaak accounting modules maar deze worden niet altijd vanaf het begin meegenomen voornamelijk vanwege de kosten en extra tijd en inspanning voor de inrichting ervan. Toch zijn er wel voordelen voor het meenemen van een accounting module in je TMS en na verloop van tijd wordt er vaak toch tot aanschaf overgegaan. Dit heeft volgens Erik te maken met drie punten:

  • Na intensiever gebruik blijkt de accounting module toch nodig door de hoeveelheid deals, wat lastig aan te sluiten is met ERP.
  • Ook de complexiteit van bijvoorbeeld exotische deals heeft vaak invloed. Door een accounting module kun je alle verplichtingen in je TMS ook meenemen.
  • Ook Hedge Accounting volgens IFRS heeft zo zijn voordelen bij het implementeren van een accounting module, het wordt makkelijker te automatiseren. De treasurer wil inzicht in eigen p&l verantwoording, EMIR.

Marktsystemen – toeters en bellen?
Er zitten natuurlijk voordelen aan het aanschaffen van een systeem als Reuters of Bloomberg. Het levert de treasurer actuele marktinformatie op; informatie over valuta´s, interest en nieuws. Op langere termijn kun je zien hoe de yield curve loopt en levert het toegevoegde waarde op; je kunt scenario’s ontwikkelen over exposure in de toekomst en daar kun je je strategie op aanpassen. Er zijn toeters en bellen die waarschuwen. Een nadeel van het aanschaffen van een marktsysteem is het kostenplaatje: zo’n 15-20K per jaar.

Static Data in je TMS – levert het wat op?
Static data lijkt het ondergeschoven kindje te zijn in een TMS, en wordt als droog en saai ervaren. Het gevaar van je static data niet op orde hebben is dat je veel tijd verliest met zoeken van essentiële data. Geen match met ERP is nog wel te overkomen maar wat als betalingen op verkeerde rekeningen terecht komen of niet uitgevoerd kunnen worden?
Het is dus van belang dit op orde te hebben maar ook om functiescheiding toe te passen; iemand voert in en iemand controleert de invoer. In treasury kan elke fout kostbaar zijn voor een bedrijf.

Menno van Suylichem

Menno van SuylichemWelke variabelen bepalen je systeemkeuze?

De doelen van een implementatie zijn kostenreductie, efficiency en risicobeperking. Variabelen die de systeemkeuze bepalen zijn onder meer: cloud versus stand-alone applicatie, functionaliteiten, modulaire opbouw, integratie met bestaande ERP systemen, reporting tools, ondersteuning leverancier, toegankelijkheid en kosten.

Voordat je überhaupt kan overgaan tot implementatie dienen de bestaande static (basis) data goed bereikbaar te zijn en gecontroleerd te worden, eventueel aangevuld met nieuwe informatie. Houdt hierbij zoveel mogelijk rekening met nieuwe (toekomstige) functionaliteiten/gebruik van het systeem.

Wat wil ik als bedrijf, wat heb ik echt nodig aan informatie, nu en in de nabije toekomst. Niet alle applicaties van een systeem zijn (direct) van toepassing. Start met de meest noodzakelijke, d.w.z. de applicaties die de dagelijkse processen en de daaruit voortvloeiende beslissingen/risico’s direct ondersteunen en beperken.

Implementatie outsourcen of zelfstandig?
Bedrijven onderschatten vaak hoeveel tijd het kost om een TMS zelf te implementeren. Reken op 12 tot 18 maanden, waarbij een persoon binnen de organisatie moet worden vrijgemaakt. Deze kennis verdwijnt vervolgens als diegene van functie veranderd of het bedrijf verlaat
Uit de zaal komt de input dat je bij het zelf implementeren alles zelf in de hand hebt, bij outsourcing zit de leverancier er niet zo midden in en weet dus niet exact wat er wel en niet nodig is. Reactie hierop is dat een goede blueprint van belang is en dat je de leverancier duidelijk opdracht kan geven over wat jij wel of niet wilt.

Inrichting systeem moet binnen de bestaande procuratieschema’s passen

Het is belangrijk de toegang tot een TMS goed in te richten. Houd ook in de gaten hoe het voorheen zat; wie mag transacties invoeren, wie mag transacties afsluiten, wie mag deze transacties invoeren en wie mag de hieruit voortvloeiende betalingsopdrachten tekenen? Meerdere mensen geven aan vaker tegen procuratie aan te lopen. Vooral omdat ze in de praktijk nog nooit hebben meegemaakt dat het hiermee mis ging.
Procedurele controle is belangrijk, dit wordt ook door de deelnemers in de zaal bevestigd, altijd alles met gescheiden autorisatie; één persoon voert in en één persoon geeft akkoord. 

Dick Bennink

Dick BenninkSysteem dwingt altijd tot aanpassingen in huidige proces – wees voorzichtig met customizen
Doe aan pakketselectie. De leverancier zegt misschien dat het kan maar tijdens de daadwerkelijke implementatie blijkt toch dat het net niet kan of helemaal niet kan. De mensen die werken bij de leveranciers zijn niet altijd werkzaam in treasury, en sluiten niet altijd goed aan op de praktijk. Systemen zijn niet perfect, probeer een balans te vinden in het veranderen of de kleine aanpassing. Blijf uit de buurt van hele grote veranderingen. Dit brengt hoge kosten met zich mee en maatwerk leidt tot een hoop extra werk.

“Meenemen” en “meekrijgen” van alle (internationale) ondernemingen bij een implementatie
Implementeren blijkt vaak een ‘hoofdkantoor-feestje’ te zijn, je bent afhankelijk van dochterondernemingen. Hoofdzaak is om mensen lager in de organisatie te laten helpen om de implementatie tot een succes te maken. Luister naar de dochterondernemingen om te zorgen dat de workload die jij aan ze oplegt om het systeem te voeden, te doen is. Kijk of er dingen in het systeem zijn die je terug kunt geven, bijvoorbeeld om de werkzaamheden makkelijker of efficiënter te laten verlopen. Zorg voor een duidelijke blueprint om aanpassingen in het lopende proces te minimaliseren. Onafhankelijk van wat je doet, zorg dat je binnen 3 maanden succes kunt vieren.

Olivier Werlingshoff

Olivier WerlingshoffSystemen maar Cash Awareness is de basis!
Cash awareness is belangrijk, er wordt veel gehamerd op TMS, rapportages en analyses. De basis is dat datgene dat ingevoerd wordt voor de liquiditeitsplanning ook zorgt voor een goede planning.

Bij liquiditeitsplanningen is de business leidend en niet de systemen
Collega’s uit de organisatie weten vaak veel beter wanneer bepaalde stromen werkelijk binnen zullen komen en eruit zullen gaan. Hetgeen dat de business aangeeft is bepalend voor de planning.

Toegang tot de TMS voor de Business
Het kan handig zijn om bij input vanuit de business de persoon verantwoordelijk te maken voor hetgeen waar ze input voor hebben gegeven, zo creëer je cash awareness binnen de organisatie omdat mensen zich betrokken voelen, verantwoordelijkheid voelen voor hetgeen ze hebben aangegeven en veranderingen worden sneller doorgegeven. Tot slot is het hiervoor handig om toegang tot de TMS te geven aan collega’s uit de business om de input te kunnen doorgeven en/of de planning te kunnen controleren.

De sessie samengevat

Het was een geslaagde, interactieve workshop die nieuwe inzichten met zich meebracht. Samen met de aanwezigen waren we het er over eens dat er een aantal onderwerpen zijn waarbij nog meer verdieping nodig is:

  1. Static data
  2. Integratie tussen systemen
  3. Blueprint
  4. Procuratie
  5. Cash awareness, (vergeten kindje, koppelen met business)
  6. Surrealistische gesprekken met leveranciers.
  7. Binnenhengelen onderliggende partij, geven en nemen

Over deze onderwerpen zullen in de komende tijd dan ook artikelen verschijnen op treasuryXL. Heb je interesse om een artikel te schrijven over een van deze onderwerpen? Neem dan contact met mij op via [email protected].

Ook namens Treasurer Search willen we alle aanwezigen bedanken voor hun komst en input. We hopen in de toekomst meer van deze interessante sessies te kunnen organiseren.

Stephanie DerkseStephanie Derkse
Community Manager

[email protected]
06-21303744

Innovation in Treasury Management: Vallstein’s walletsizing

31-05-2016 | Huub Wevers from Vallstein

On april 13th of this year the Fintech innovation awards took place. Vallstein won the innovation award in treasury management with their Walletsizing® system. We asked Huub Wevers from Vallstein to give us an update on this new system. What’s new about it and who will benefit from using Walletsizing®?

Congratulations on winning the award, can you tell us more about WalletSizing?

WalletSizing® is a system in the cloud focused on giving full transparency to corporates on their spending and profitability for banks. All their banks globally, regardless of the number of banks and the type of products, varying from Fx, Cash Management, bonds, lending or asset management. We take in all data a corporate has available on the products and invoices from the bank in an innovative easy way for the corporate where they do not need to do much with the data. We translate, map and upload it into the system after which the corporate has all insight in their banking landscape and can do easy analysis with all the features the system offers.

What distinguishes WalletSizing® from its competitors?

Firstly, WalletSizing® looks at the entire bank relationship, across all product areas, not just transaction services or credit, but everything that is being used from all banks that maintain a relationship with the client concerned. Secondly, we take an explicit view through the eyes of the bank on the relationship, taking all relevant Basel III /IV regulation into account. This kind of transparency is absolutely essential to identify the real room to negotiate and ensure terms and conditions that are truly fair for both sides of the table. Thirdly: technology. We provide analysis for clients maintaining multiple bank relationships across a multitude of countries with many different banking products, which is impossible to build and let alone maintain in spreadsheets.

ROS Calculation 2


Who will benefit from using this system?

CFO’s and Treasurers will benefit by having full transparency in the bank relationships and as a result they will have more meaningful bank reviews, RFP’s and Negotiations. Depending on the objectives a corporate has, it will allow them to be fair in their distribution of business towards banks, limit the number of banks used globally or keep banks costs in line with market practice as will be indicated by the system’s benchmarking capabilities. Where cost saving was an objective, corporates saved 26% on their bank costs on average, across the entire relationship, all products.

Vallstein won the Fintech innovation Award 2016, what is innovative about your system?

We take away the need for extensive data gathering, translating and analysis by taking this responsibility upon us and we create full transparency using all data and the latest Basel III rules in a matter of days. Comparing banks like for like. Next to this we have extended the functionalities last year by having a edition focused on Bank Fee Analysis as well. The system verifies automatically after upload of new invoices if the prices paid are as agreed earlier with the banks. A simple and somewhat more operational step.

Can you give some examples of companies and employees that are using Walletsizing®?

Examples of Companies that are currently using WalletSizing® are SaudiAramco, Salzgitter, Vimpelcom and many more. Typically, the Treasury Control department works with the system on a day to day basis and depending who is having the bank reviews the Treasurer or CFO will be using the reporting.


Picture_HWHuub Wevers is responsible for Corporate Solutions at Vallstein, the leading Bank Relationship Management specialist. Before joining Vallstein he has had eighteen years of experience in Banking at ABN AMRO and RBS, notably Transaction Banking. His responsibilities included Product Management, Account Management, Implementation and Operations, whereby his last role was the leadership of all Service & Operations in EMEA for RBS. At Vallstein Huub is responsible for building out the software solutions that Vallstein offers for corporates. Solutions that automate bank relationship management in order to assess the profitability that a corporate has for their banks, using all banking products and Basel III.