How to improve your working capital with Trade Finance instruments
| 22-5-2017 | Olivier Werlingshoff |

Trade finance instruments are developed especially for companies that deal with export and/or import of goods to reduce risk but also to improve the working capital. Before going into the working capital part first let us refresh the theory.
If you are an importer of goods you would like to be sure the goods you will receive are the same as the goods you ordered. How can you be sure that the exporter sent you the right quality of goods and the right quantity, or that he sent them at all? One of the possibilities you have to reduce that risk is to pay after receiving the goods. If the quality and the quantity do not match with what you ordered, you simply do not accept the goods and do not pay the invoice.
At the same time the exporter of goods is worried that after sending you the goods, the invoice will remain unpaid after the agreed payment period. What if the client does not accept the goods in the harbor? He would then have to arrange for new transport to return the goods or try to find new clients in a short period of time.
There is a lot of risk for both parties especially when they do not know each other very well or if they are located on different continents.
Letter of Credit
In this case a Letter of Credit could be a solution. With a Letter of Credit you make agreements with the exporter about the quality and the quantity of the goods that you buy, and how, when and where the goods will be shipped to. Only if all terms and conditions of the Letter of Credit have been met the bank will pay the invoice. A lot of paper work will be part of the agreement for instance a Bills of Lading, a commercial invoice, a certificate of origin and an inspection certificate. As an additional security, the exporter can have the Letter of Credit confirmed by his bank.
In a nutshell this is the basic of how Letters of Credit (L/C) works.
Working Capital
Now you can ask the question how could this improve your working capital?
Firstly you will have more security that the payment will be made, therefore the risk of nonpayment will be reduced.
With trade finance you could also set up a line of credit based on your security and overall financial situation.
For the importer, he can finance the gap between paying the exporter and selling the goods to a buyer or use it for manufacturing purposes.
For the exporter, he can fund the gap between selling the goods and receiving payments from the buyer.
If there is not enough equity or there are no sufficient credit lines available, there is another option. Transaction Finance, hence the goods you will sell. [Export L/C] are used to fund [collateral] the buying of these same goods [Import L/C] This is called a Back to back L/C.
There could be a fly in the ointment, however! What happens when there is a mistake made in the paperwork? If this is a small mistake both parties would agree the transaction will go forward. But if during shipment the prices of the goods drop the importer will maybe not be very collaborative and will grab this opportunity to refuse the goods and not to pay the invoice!
Since the credit crisis the use of L/C’s went through the roof. If you need consultancy advise on this topic, drop us a line!

Group Treasury Director
More articles from this author:
 Our expert Carlo de Meijer is our blockchain specialist and publishes his articles on a regular basis. We present his latest article about blockchain and supply chain finance in a shorter version.
 You might visit this site, being a treasury professional with years of experience in the field. However you could also be a student or a businessman wanting to know more details on the subject, or a reader in general, eager to learn something new. The ‘Treasury for non-treasurers’ series is for readers who want to understand what treasury is all about. Today our expert François de Witte will explain de difference between long term and short term debt.
 François de Witte – Founder & Senior Consultant at
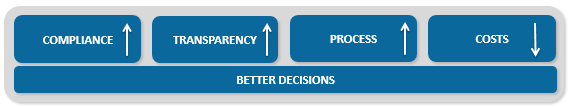
  How do strategic professionals decide on the best path to success for their company? The key is in transparency and real-time reporting. If it comes to the responsibility of the treasurer or financial professional this means deciding about company-wide cash flow and liquidity levels, bank, customer and supplier relations and working capital.
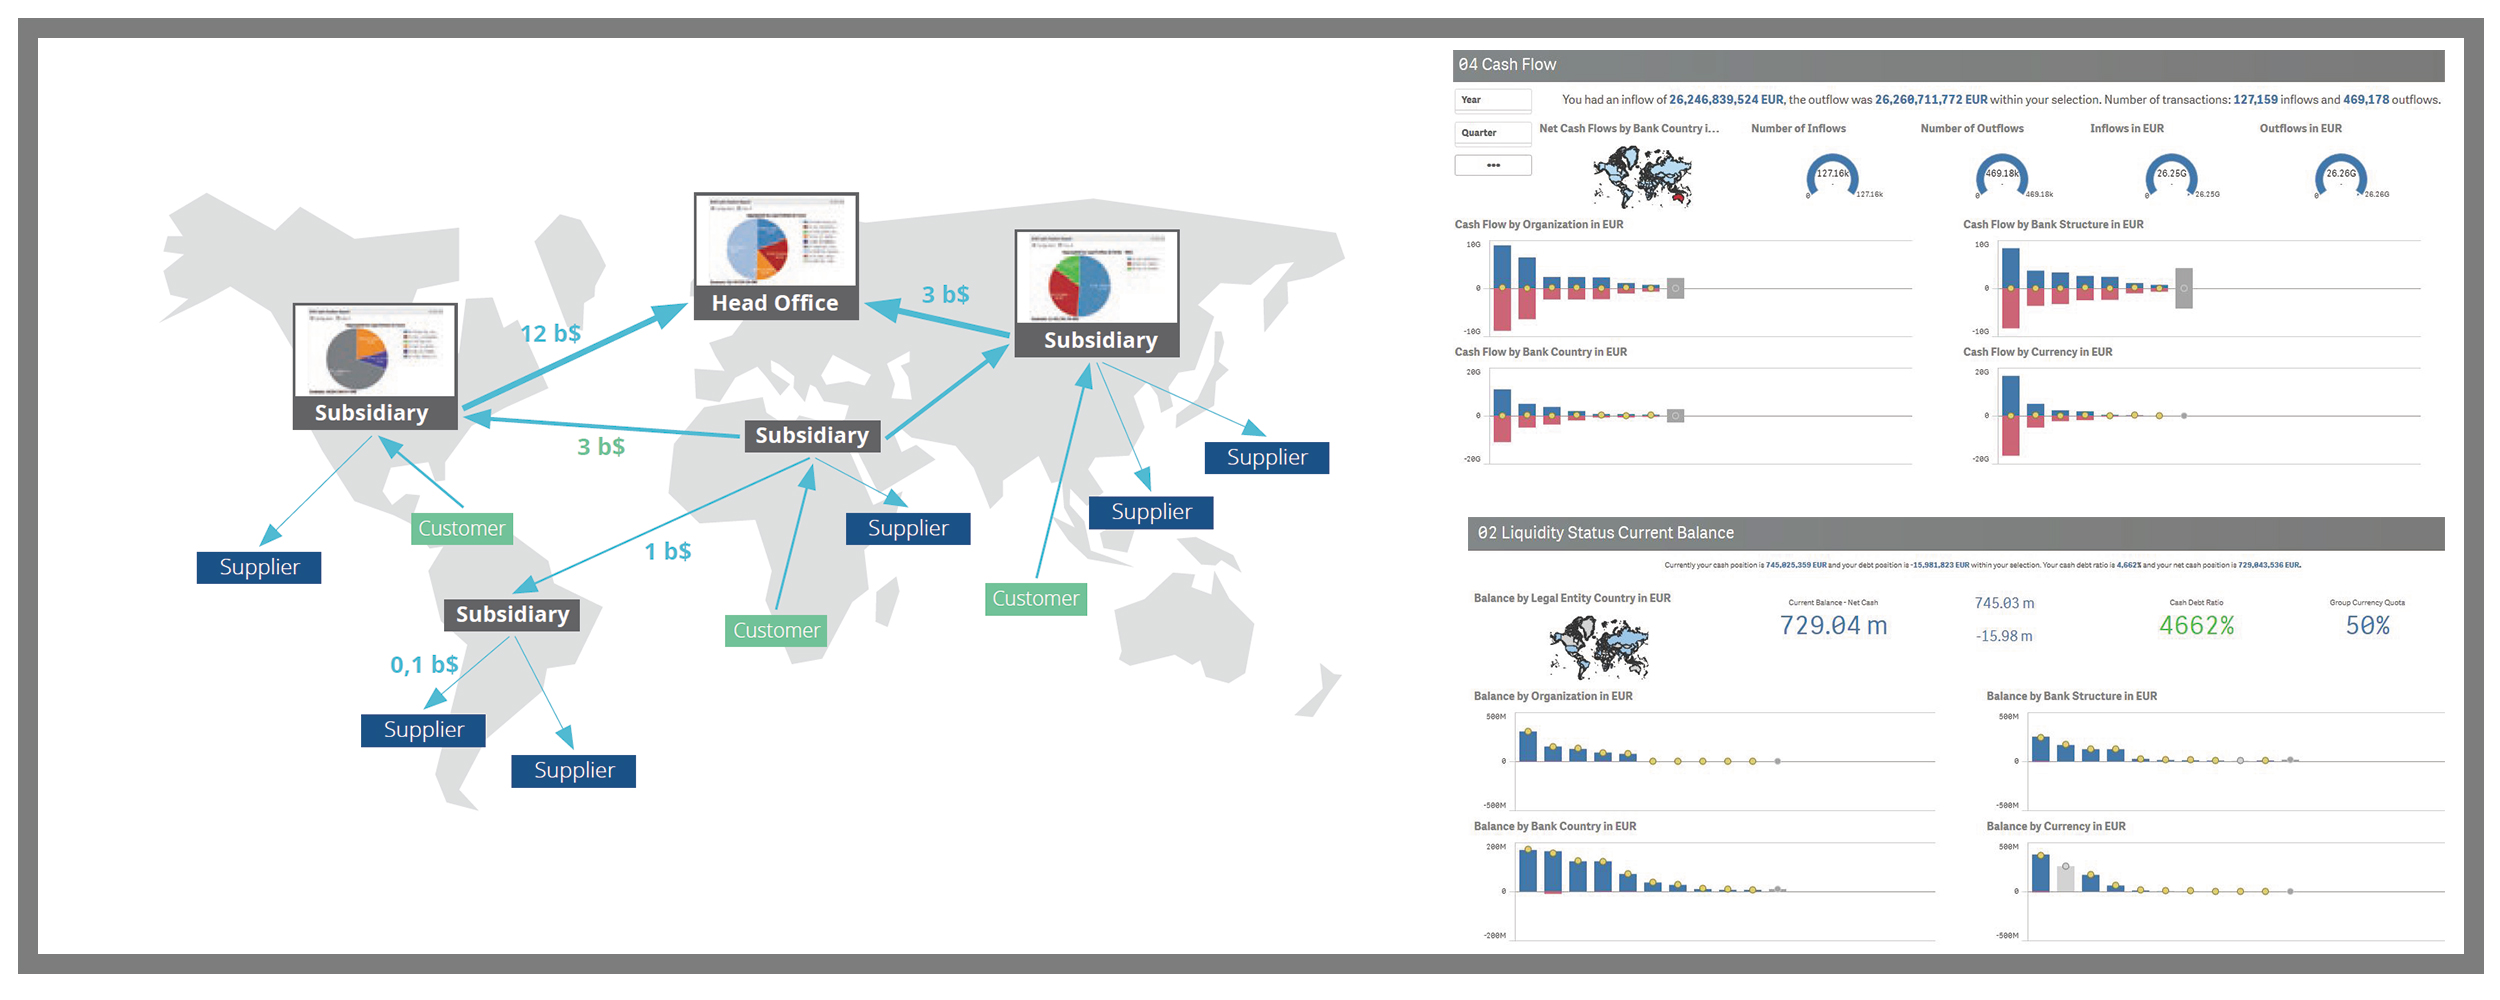

 MIFID II – you read about it frequently. And there are more abbreviations: you will also find MIFIR and MIFID I. As a banker you will know what we are talking about. As a treasurer or financial professional you are supposed to understand what MIFID II will bring you. We think it is time to zoom in on this subject and present a short summary.
 Annette Gillhart – Community Manager treasuryXL

 Now also The Netherlands (I am a Dutchman!) has its broad-based collaborative blockchain initiative. At the end of last month (30 March 2017), there was the official kick-off of the National Blockchain Coalition (“Nationale Blockchain Coalitie” in official Dutch language) (NBC) at the premises of the Ministry of Economic Affairs in The Hague. The National Blockchain Coalition is a collaboration of more than 20 organisations, governmental institutions and knowledge centres. At the same event the action agenda was handed over to The Dutch Economics Minister Henk Kamp on behalf of the partners of the NBC.