Zero Coupon Yields and implied Forward Yields
| 13-06-2016 | Lionel Pavey |
Having constructed our 20 year yield curve with both observable data and discovered data in my previous article,we are now in possession of 3 sets of data:
- Spot par rates
- Spot zero coupon rates
- Discounted Cash Flow factors (DCF)
The most important of these, for calculation purposes, is DCF.
Present Value
The discounted present value of a future cash flow can be calculated by dividing the future value by the DCF. It therefore follows that a series of future cash flows can also be discounted to a single net present value.
Implied Forward Rates
The original yield curve showed annual spot rates for a period of 20 years. Using DCF it is possible to construct similar curves but with forward start dates – a curve starting in 1 year, 2 years, 3 years etc. When building these curves the “implied” forward rate will actually be a zero coupon rate and not a par rate. Converting the zero rates to par rates can be achieved by using Excel Solver – a very useful tool but great care must be taken as Solver gives an answer but shows no formula.
So, how do we calculate an implied forward rate?
Let us assume that we wished to find a rate with a duration of 4 years, starting 5 years forward.
To achieve that, we need both the 5 year DCF and the 9 year DCF
The previous constructed curve yields the following values –
5Y DCF = 0.9464924176
9Y DCF = 0.8508986778
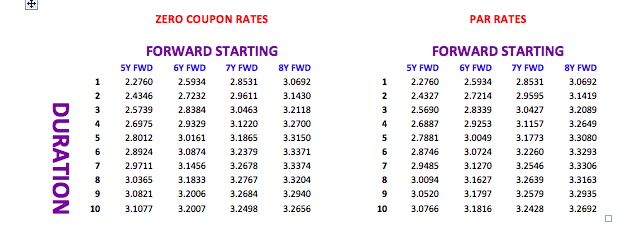
((.9464924176/.8508986778)^(1/4)-1)*100 = 2.6975% implied 4 year rate starting in 5 years
As stated, this is the implied zero coupon rate – the implied par rate is 2.6887%
All forward rates are purely implied rates – a true quoted rate would always be different for various reasons –
- Spread between bid and offer
- Yield curve constructed with specific data
- Sentiment of the trader
- Possible exposure already in the banks’ books
Here is a small snapshot of both implied rates and par rates built with the original curve.

When I discussed building the original yield curve, different ways of interpolation were tried. I would now like to show how small differences in yields in a spot curve can lead to significant differences in a forward curve.
Let us look at a duration of 5 years starting 10 years in the future and compare the linear interpolation with the smooth adjusted curve. Assume that the instrument to be priced is a linear instrument – equal repayments of principal every year.
I have built both curves using the same layout and formulae throughout with the exception of the input rates in the missing periods.
The linear rate is 3.276%; the smooth adjusted rate is 3.416% – a difference of 14 basis points or about 4% of the smooth rate. In a market where the normal bid/offer spread is about 3 or 4 basis point, this represents a significant difference/anomaly.
I regularly hear people say that when they need to purchase a financial instrument that they get at least 2 quotes – this is all very well but does not stop a treasurer from first ascertaining what the correct price should be before getting a quote. If banks know that, as a treasurer, you can not calculate the theoretical price this allows them to move the price away from the implied to a price that is more advantageous to them and their trading book! A dedicated financial data vendor system can make life easier, but it is not impossible to calculate a price without these resources!
Next – Spreads; their use and the hidden extra costs
First two articles on building a yield curve:
1. Yield Curves (term structure of interest rates) – filling in the blanks
2. Yield Curves (term structure of interest rates) – filling in the blanks part II

Treasurer


