Tag Archive for: yield curves

Managing treasury risk: Interest rate risk (Part II)

|31-1-2017 | Lionel Pavey |


There are lots of discussions concerning risk, but let us start by trying to define what we mean by risk. In my first article of this series I wrote about risk managment and what the core criteria are for a solid risk management policy. Today I want to focus on interest rate risk. There are 4 types of interest rate risk.


Absolute Interest Rate Risk

Absolute interest rate risk occurs when we are exposed to directional changes in rates – either up or down. This is the main area of rate risk that gets monitored and analysed within a company as it is immediately visible and has a potential effect on profit.

Yield Curve Risk

Yield curve risk occurs from changes between short term rates and long term rates, together with changes in the spreads between the underlying periods. Under normal circumstances a yield curve would be upward sloping if viewed as a graph. The implication is that longer term rates are higher than short term rates because of the higher risk to the lender and less liquidity in the market for long dated transactions. Changes to the yield curve (steepening or flattening) can have an impact on decisions for investment and borrowings, leading to changes in profit.

Refunding or Reinvestment Risk

Refunding or reinvestment risk occurs when borrowings or investments mature at a time when interest rates are not favourable. Borrowings or investments are rolled over at rates that had not been forecast leading to a potential loss on projects or investments.

Embedded Options Risk

Embedded options are provisions in securities that cannot be traded separately from the security and grant rights to either the issuer or the holder that can introduce additional risk. Benefits for the issuer can include a call option, a right to repay before maturity without incurring a penalty, an interest rate cap. Benefits for the holder can include a put option, a conversion right via convertible bonds, an interest rate floor.


An attempt can be made to calculate the interest rate risk on either a complete portfolio or on individual borrowings or investment. This is done by comparing the stated interest rate to the actual or projected interest rate. Methods include:

  1. Mark to market
  2. Parallel shift in the whole yield curve
  3. Tailor-made shift in the whole yield curve
  4. Duration, DV01, Convexity
  5. Value at Risk (VaR)

These are all forms of quantitative analysis and well recognized. Personally I am of the opinion that VaR is not a very good method for interest rates. Interest rates do not display normal Gaussian distribution – they do not resemble a normal bell curve. Interest rate distribution curves display fat tails compared to normal statistical models.

Financial products that are commonly used to manage interest rate risk include FRAs, Futures, Caps, Floors, Collars, Options, Interest Rate Swaps and Swaptions.

Lionel Pavey


Lionel Pavey

Cash Management and Treasury Specialist


More articles from this author:

Safety of Payments

The treasurer and data

The impact of negative interest rates

How long can interest rates stay so low?


Constructing a yield curve for local authority loans

| 22-06-2016 | Lionel Pavey |

yieldcurves_lionelpaveySo far in this series we have constructed yield curves based on Interest Rate Swaps. This route was chosen as Swaps provide the benchmark for pricing many loan products. Let us look at constructing a yield curve for local authority loans. Yet again, the choice has been made for a product where prices are published on a daily basis.
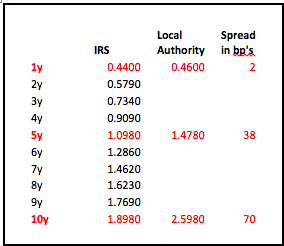
The data that is published is not as comprehensive as that for Swaps but, using the procedures shown before, we are still able to build a curve. Only 3 data points were published – 1 year, 5 year and 10 year. It is thus possible to build a 10 year curve – the data is as follows:


Going back to the principles employed when building the IRS curve we shall make a first attempt by using linear interpolation of the spreads – a reasonably obvious approach. I shall save you all the calculations and simply say that this approach leads to an implied 1 year constant maturity curve that is not completely smooth – there is a peak in the period starting in 4 years.

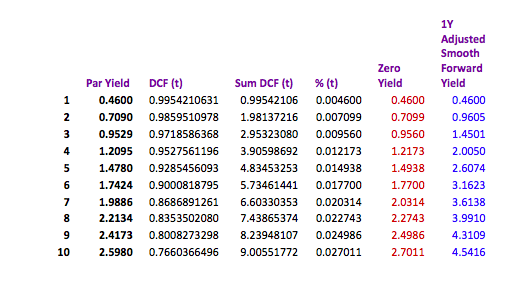
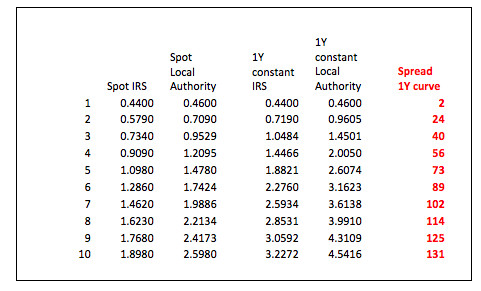
Obviously you could manually alter the prices to achieve a better curve or make use of a curve building model like Nelson & Siegel. Personal experience has resulted in my preference being to calculate the ratio between the local authority rates and the swap rates and allowing the model to find a best fit. Ratios are generally less volatile than the input rates allowing for a better fit. Eventually an implied local authority curve can be built as shown below:

Schermafbeelding 2016-06-20 om 12.37.42

As previously shown the spread is also monotonic – constantly rising. Consider the implications if we know that a 10 year loan has a spread of 70 basis points over swaps whilst the 1 year loan has a spread of only 2 basis points over swaps.

A 10 year spread can also be defined as the weighted average of all the underlying 1 year constant maturities, so let us investigate how this works in this model:

Schermafbeelding 2016-06-20 om 12.37.51

A 10 year spread of 70 basis points starts with a spread of 2 basis points in the 1st year rising in the 10th year to 131 basis points when compared to the underlying implied 1 year constant swap curve. As a treasurer it is important to know how rates are constructed and determine for yourself what the best approach is to your funding needs. Where do you think rates will be in the future, what will the spreads be, borrow for 10 years or borrow for 5 years and renegotiate? A fixed spread is therefore very advantageous for the lender.

No one knows the future but the ability to calculate the implied future price can assist in making decisions now regarding the future. Long dated fixed loans are difficult to break open leading to potential opportunity losses. Bullet loans are the easiest to price, but by focusing only on the cash flows and not their individual time buckets it is possible that the best decisions are not always made. Linear loans are less transparent when pricing but, yet again, a different time approach can be used to make the process simpler. Rollercoaster loans used in construction and infrastructure projects are the most opaque but can also be viewed in a different light if approached in another manner.

Next – Opportunity loss/profit. If I could turn back time or see into the future


Lionel Pavey


Lionel Pavey

Cash Management and Treasury Specialist – Flex Treasurer


Zero Coupon Yields and implied Forward Yields

| 13-06-2016 | Lionel Pavey |


Having constructed our 20 year yield curve with both observable data and discovered data in my previous article,we are now in possession of 3 sets of data:

  1. Spot par rates
  2. Spot zero coupon rates
  3. Discounted Cash Flow factors (DCF)

The most important of these, for calculation purposes, is DCF.

Present Value

The discounted present value of a future cash flow can be calculated by dividing the future value by the DCF. It therefore follows that a series of future cash flows can also be discounted to a single net present value.

Implied Forward Rates

The original yield curve showed annual spot rates for a period of 20 years. Using DCF it is possible to construct similar curves but with forward start dates – a curve starting in 1 year, 2 years, 3 years etc. When building these curves the “implied” forward rate will actually be a zero coupon rate and not a par rate. Converting the zero rates to par rates can be achieved by using Excel Solver – a very useful tool but great care must be taken as Solver gives an answer but shows no formula.

So, how do we calculate an implied forward rate?

Let us assume that we wished to find a rate with a duration of 4 years, starting 5 years forward.
To achieve that, we need both the 5 year DCF and the 9 year DCF

The previous constructed curve yields the following values –

5Y DCF                    =               0.9464924176

9Y DCF                    =               0.8508986778

((.9464924176/.8508986778)^(1/4)-1)*100     =  2.6975% implied 4 year rate starting in 5 years

As stated, this is the implied zero coupon rate – the implied par rate is 2.6887%

All forward rates are purely implied rates – a true quoted rate would always be different for various reasons –

  1. Spread between bid and offer
  2. Yield curve constructed with specific data
  3. Sentiment of the trader
  4. Possible exposure already in the banks’ books

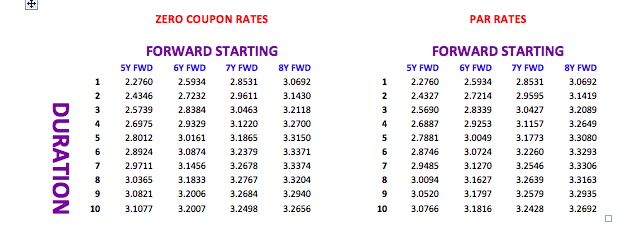
Here is a small snapshot of both implied rates and par rates built with the original curve.

parrates complied rates

When I discussed building the original yield curve, different ways of interpolation were tried. I would now like to show how small differences in yields in a spot curve can lead to significant differences in a forward curve.

Let us look at a duration of 5 years starting 10 years in the future and compare the linear interpolation with the smooth adjusted curve. Assume that the instrument to be priced is a linear instrument – equal repayments of principal every year.

I have built both curves using the same layout and formulae throughout with the exception of the input rates in the missing periods.

The linear rate is 3.276%; the smooth adjusted rate is 3.416% – a difference of 14 basis points or about 4% of the smooth rate. In a market where the normal bid/offer spread is about 3 or 4 basis point, this represents a significant difference/anomaly.

I regularly hear people say that when they need to purchase a financial instrument that they get at least 2 quotes – this is all very well but does not stop a treasurer from first ascertaining what the correct price should be before getting a quote. If banks know that, as a treasurer, you can not calculate the theoretical price this allows them to move the price away from the implied to a price that is more advantageous to them and their trading book! A dedicated financial data vendor system can make life easier, but it is not impossible to calculate a price without these resources!


Next – Spreads; their use and the hidden extra costs

First two articles on building a yield curve:
1. Yield Curves (term structure of interest rates) – filling in the blanks
2. Yield Curves (term structure of interest rates) – filling in the blanks part II


Lionel Pavey


Lionel Pavey

Treasurer


Yield Curves (term structure of interest rates) – filling in the blanks part II

| 03-06-2016 | Lionel Pavey |

Most treasurers do not have access to a dedicated financial data vendor (Bloomberg, Reuters) but are regularly faced with having to discover prices related to yield curves. There are websites that can provide us with relevant data, but these are normally a snapshot and not comprehensive – the data series is incomplete. It is therefore up to the treasurer to complete the series by filling in the blanks. In my previous article I went over the first approach. Today I’ll talk about the second approach.

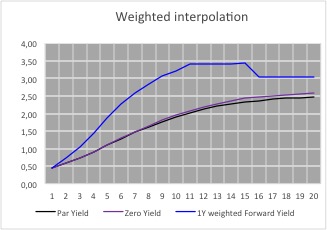
A second approach would be to apply a weighting to the known periods of the par curve and to average the difference out over the missing periods.

grafiek1_part2

Schermafbeelding 2016-06-02 om 13.49.46

This leads to 1 year constant maturity rates that are almost equal in value for all the periods between 2 known periods. Whilst these forward rates are also not correct they at least supply us with a visual indicator as to the general shape of the forward yield curve – the 1 year constant maturity rates

reach their zenith between years 12 and 14; after that point they then start to decrease.

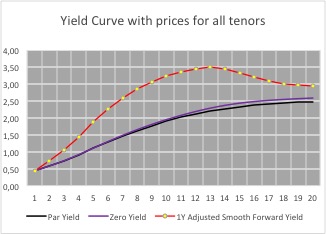
Futhermore, taking into consideration the yield curve as shown in the graph, we can make the following conclusions about the 1 year curve:-

  • 11 year rate must be higher than the linear interpolated rate but lower than the weighted interpolated rate
  • 13 year rate must be higher than the weighted interpolated rate
  • 15 year rate must be lower than the linear interpolated rate and lower than the weighted interpolated rate
  • 16 year rate must be higher than the linear interpolated rate and higher than the weighted interpolated rate
  • 20 year rate must be lower than the linear interpolated rate and lower than the weighted interpolated rate
  • The implied forward 1 year constant maturity curve must be smooth and monotonic.

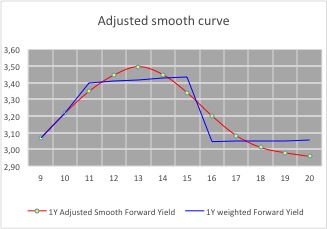
On the basis of these restraints a par curve can be built that leads to the following forward curve.

grafiek2_part2Schermafbeelding 2016-06-02 om 13.50.01

The rates for the missing periods have been calculated manually whilst adhering to the conditions mentioned before– there are formulae which would allow rates to be discovered (Cubic spline, Nelson Siegel etc.) – but these rely on random variables and I have yet to see anyone quote and trade prices based solely on a mathematical formulae.

Visually, the 1 year curve meets all the criteria for the construction of a yield curve, together with the underlying par and zero yield curves.

grafiek3_part2


To ascertain that the rates are correct, discount all the cash flows of the par yield for the given maturity – they should equal 100.

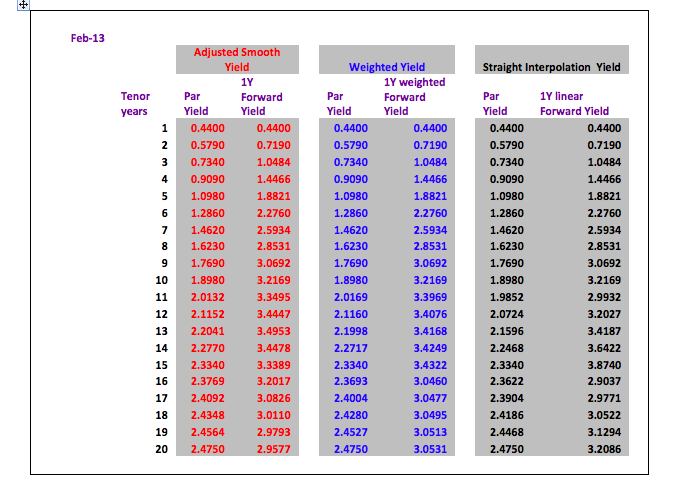
Here is an overview of all the implied 1 year rates using the different methods to construct the yield curve.

Conclusion:

For a quick calculation a straight line interpolation is acceptable with the warning that with a normal positive yield curve the real prices will be higher than the prices calculated by straight line interpolation. For a negative yield curve this would be reversed – real prices lower than interpolated prices.

The average difference between the par yield prices of the adjusted smooth yield and the straight interpolation yield are only 2.5 basis points. However, this difference is magnified when looking at a 1 year forward yield curve where the average difference is 22.5 basis points per period with a maximum of 53.5 basis points.

Next – Zero Coupon Yields and implied Forward Yields

Would you like to read part one of this article?
– Yield Curves (term structure of interest rates) – filling in the blanks


Lionel Pavey


Lionel Pavey

Treasurer


Yield Curves (term structure of interest rates) – filling in the blanks

| 27-05-2016 | Lionel Pavey

Most treasurers do not have access to a dedicated financial data vendor (Bloomberg, Reuters) but are regularly faced with having to discover prices related to yield curves. There are websites that can provide us with relevant data, but these are normally a snapshot and not comprehensive – the data series is incomplete. It is therefore up to the treasurer to complete the series by filling in the blanks.

A quick refresher about the construction of a yield curve raises the following points:-

  • All data must be from the same market (treasury bonds, Interest Rate Swaps (IRS) etc.)
  • A regular term (maturity) is preferred for ease of construction
  • A curve must be smooth
  • An implied zero yield curve can be built from the smooth par curve – a theoretical yield curve where no interest is paid until maturity. In a bond this would redeem at par (100) and be issued at a deep discount to par
  • A series of discounted cash flow factors (DCF) are produced
  • An implied forward curve with constant maturities can be built from the par curve
  • An implied forward curve must be monotonic – each point in an increasing sequence is greater than or equal to the preceding point, each point in a decreasing sequence is smaller than or equal to the preceding point

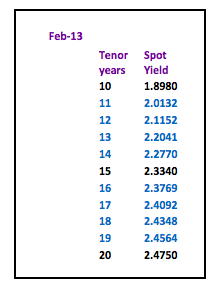
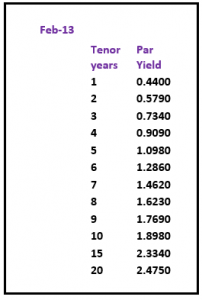
If we look at IRS par yield prices that can be found on a website, we can regularly see yield prices for periods from 1 year to 10 year inclusive, a 15 year price and a 20 year price. To construct a complete curve from 1 year up to and including 20 years we need to fill in the blanks at 11,12,13,14,16,17,18 and 19 years. These yields are assumed to be par yields – the coupon rate is equal to the yield to maturity and the instrument trades at par.

Before starting let us define the procedure for constructing a par yield curve:-
The methodology used is called “bootstrapping”. This allows us to extract discount factors (DCF) from the market rates. DCF’s allow us to calculate a value today for a cash flow in the future.

We assume that the nominal value for all calculation purposes is 100

For a 1 year rate we know the interest and redemption amount at maturity. A DCF is built whereby the net present value (NPV) of these future cash flows in 1 years’ time is equal to 100 or par.

For a 2 year rate we receive interest after 1 year and interest and redemption amount at maturity.

We discount the 1st years’ interest with the DCF we obtained from the 1 year rate and deduct this amount from our initial nominal of 100. This net amount is then divided by the interest and redemption at maturity (at end of 2 years) to obtain the DCF for the 2 year rate.

Example:

1 Year                                      7%                          2 Year                          9%

1 Year      
100 / (7/100+100) = 0.93457944 (DCF)

2 Year
9 * 0.93457944 = 8.41121496
100 – 8.41121496 = 91.58878504
91.58878504 / (9/100+100) = 0.8402640829

These DCF’s can then be used to find the NPV of any cash flow maturing in 1 or 2 years’ time.

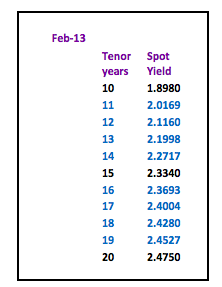
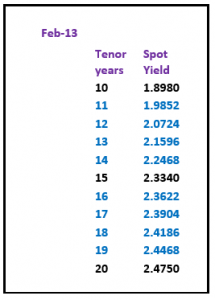
The following example shows a yield curve from February 2013 published on the website of an interbank broker.

yield curve February 2013

yield curve February 2013

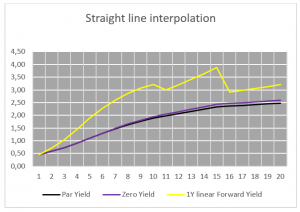
The quickest way to price the missing periods would be with straight line interpolation of the par curve between the known points – which would produce the following par curve, zero yield curve and forward curve with constant 1 year maturity.

yield curve February 2013 - 2

yield curve February 2013

Straight line interpolation

Straight line interpolation


Whilst the par curve and zero curve are smooth, the implied 1 year constant maturity curve is jagged and certainly neither smooth nor monotonic. The 11th 1 year period rate is lower than the 10th period and the 15th 1 year period rate is higher than the 16th period.

A second approach would be to apply a weighting to the known periods of the par curve and to average the difference out over the missing periods. Read more on this second approach in my next article which will appear next week.

Lionel Pavey


Lionel Pavey

Treasurer