Best read articles of all time – FX Swaps vs Libor and EURIBOR: Arbitrage opportunities?
| 10-05-2018 | Rob Söentken |

As we are getting closer to the end of the month, end of Q2 and end of H1 of 2016, it is interesting to see financial markets are maneuvering to get the right liquidity on board for the balance sheet. Or get rid of the unwanted liquidity. For firms with liquidity in various currencies the best means for liquidity management is FX swaps.
What is an FX swap?
In a very simple definition the FX swap is like an exchange of deposits. The big advantage is that the counterparty risk is reduced due to the exchange of notional. Operationally an FX swap is booked as two FX transactions: one to convert and another to revert. The conversion rate is against the prevailing exchange rate. The reversion rate is against the conversion rate plus or minus some ‘swap points’, which reflect the interest rate differential between the respective currencies. During the tenor the exchange rate could change, which creates counterparty risk on the mark-to-market value of the reversion. Mark-to-market risk for tenors up to 1 year is still a small when compared to full notional risk.
How would an FX swap work in theory?
In diagram 1 the Libor and Euribor fixings for USD and EUR are listed for the respective tenors. 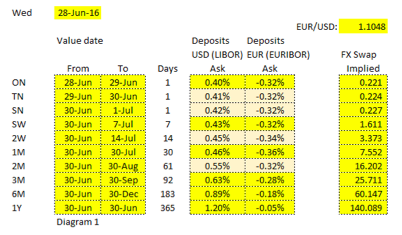 Now if we would consider exchanging a USD deposit versus a EUR deposit for 1 year the cash flows would be as follows:
For the conversion date we take value spot (ie 2 days, in this case that is per June 30th) and we agree to exchange EUR 1 Mio vs USD 1.1048 Mio (because EUR 1 Mio at current spot of 1.1048 is USD 1.1048 Mio)
For the reversion date we take the value date for 1 year from today’s spot date. We calculate the following amounts including interest:
EUR 1 Mio x (1 + -0.05% x 365 / 360) = EUR 999,493.06
USD 1.1048 Mio x (1 + 1.20% x 365 / 360) = USD 1,118,241.73
Dividing the USD amount by the EUR amount gives the exchange rate for the reversion on the forward date, in this case that is 1.1188089. This is called the ‘forward rate’ The difference to the spot exchange rate is 0.0140089. For simplicity reasons this is multiplied by 10,000 to 140.089. This reflects the interest differential.
When executing an FX swap the EUR amounts are kept constant for both the spot and forward dates. But the USD amounts are calculated using the spot and forward exchange rates as calculated above. Therefor the interest differential is reflected in the USD amount being different between spot and forward date.
How does it work in reality?
As I mentioned at the beginning of this article, the current situation is special because we are getting close to a date special and important for balance sheet reporting. Supply and demand may push the market in a direction.
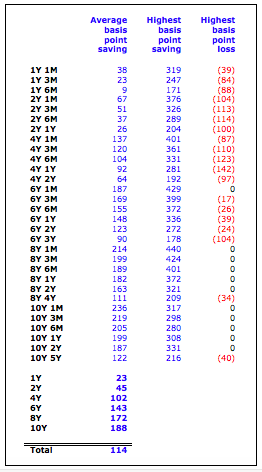
When looking at the actual FX swap rates and taking the EUR Euribor fixings as given, we can deduce the implied USD funding rates (see diagram 2). First observation is that the FX swaps appear to reflect either a substantial demand for USD from June 30th to July 1st, or a EUR supply. It is interesting to see that the 1 week fixing for EUR was not affected, while the 1 week FX swap was affected maybe 20 bppa. One reason could be the timing of the rates. Euribor is taken at one moment during the day, while FX swaps are affected by events during the day. Because w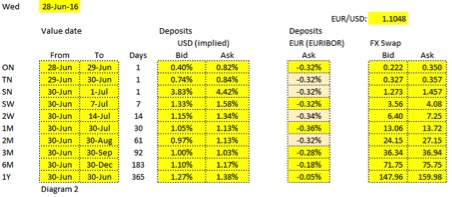 e are looking at a single day FX swap, the annualized rate could swing a lot.
Another observation is that the interest rate differential between EUR and USD is actually bigger than implied by the fixings. For one month tenor the difference is 0.59% p.a.. It would seem possible that supply – demand forces can push FX swaps away from the deposit markets. Likely the counterparty limit constraints on pure deposits keep them from being arbitrages vs FX swaps, like they used to be many years ago.
How can a treasurer benefit from FX swaps?
Each individual and organization should determine for itself what he/she or it needs. And I do not want abstract from discussions around documentation requirements, collateral financing and administration, and the operational extra work. It seems obvious that there are opportunities to investigate.
One key area would be to look at the bid-offer spreads on cash liquidity in various currencies as provided by house-banks and compare those rates with and without using FX swaps. Also I could imagine non-house banks could be more competitive in providing FX swaps, while the counterparty risk is substantially smaller than when pure lending is concerned.

Ex-derivatives trader
 In the last year both the ECB in regard of EURIBOR and the FCA in London in regard of LIBOR have come to the same conclusion – the fixing of interest rate indices can not carry on in their present form. The current benchmarks are tainted by allegations of fraud and malpractice. Furthermore, the way that the rates are determined are also criticized – no actual transactions take place at the fixing price when the fix is made daily. But the big problem is that these fixings are intrinsically linked to financial contracts with values measured in 100 of trillions of EUR, USD, GBP etc.
 Lionel Pavey – Cash Management and Treasury Specialist
 Money Market outlook
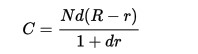 where N is the notional of the contract, R is the fixed rate, r is the published -IBOR fixing rate and d is the decimalized day count fraction over which the value start and end dates of the -IBOR rate extend.
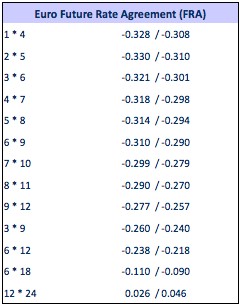

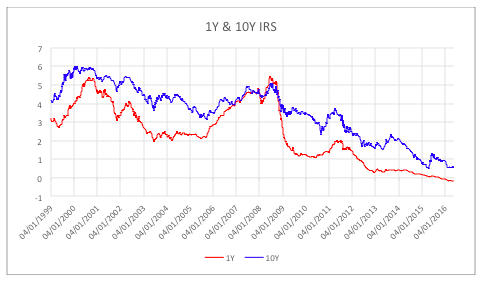
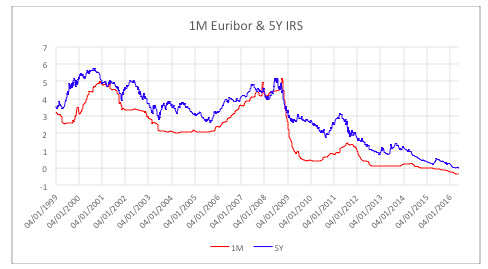
 The markets and the ECB feel that the economy is doing very well. It can be compared to Goldilocks – not too hot and not too cold. Is it possible that the Eurozone could be entering a period of continued growth with little or no immediate prospect for rising inflation? A quick scan of the relevant markets would appear to suggest that it is possible. Let us examine where the markets are now.
 U kunt de zekerheid kopen dat u over uw variabele financiering nooit een hoger 1- maands Euribor tarief betaalt dan 0.25% (exclusief de opslag uiteraard). U blijft gewoon het 1 maands Euribor betalen zolang dit onder het 1 maands Euribor onder de 0.25% blijft.
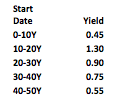
 A normal yield curve is usually upward sloping with diminishing increases in yield– the longer the tenor, the higher the interest rate. Generally it is assumed that longer maturities contain larger risks for lenders and they require adequate compensation with a risk premium in the form of a liquidity spread.
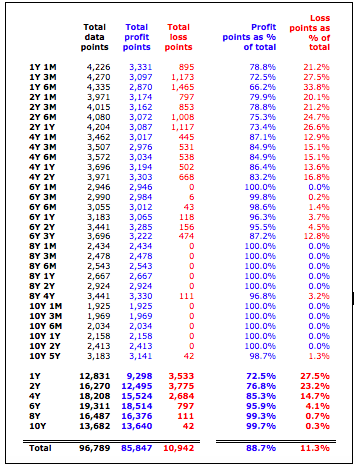

 Willem van Overveld beschrijft hoe een simpele SWAP constructie zonder margin calls toch lastig kan worden: de menselijk organisatorische kant van derivaten constructies krijgt vaak te weinig aandacht. Een voorbeeld uit de praktijk:
 Willem van Overveld – Allround finance / treasury professional