
Are public debts sustainable?
| 19-02-2018 | treasuryXL |
 A few weeks ago the EU Commission released a report on debt sustainability within the EU. It provides an overview of the challenges faced by member countries over the short, medium and long term to meet the original convergence criteria – specifically, that existing Government debt is less than 60% of GDP. As with most Government related documents it is long – over 250 pages. A lot of attention is drawn to the Debt Sustainability Monitor (DSM) and the challenges faced to achieve the abovementioned criteria by 2032.
Any forecast is open to different interpretations, especially one that looks 15 years into the future. At the end of 2017, 15 of the 28 countries within the EU (in other words more than 50%) have Government debt that exceeded 60% of GDP. The average ratio for all 28 countries – on the basis of the sum of all Government debt and all GDP – is 83%. Let us focus on those 15 countries who, currently, do not meet the criteria. The figures for this article have been taken from the following website – debtclocks.eu
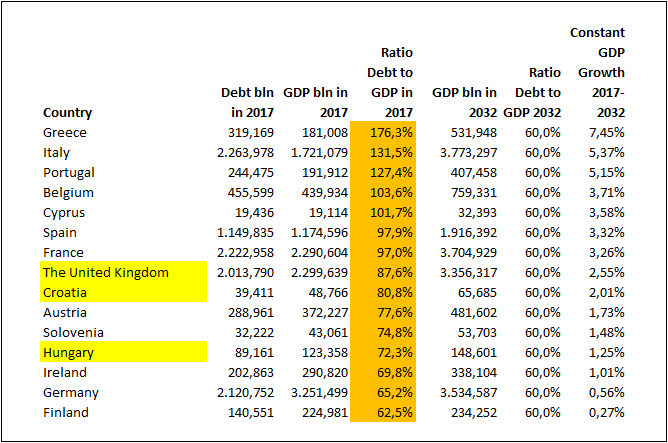
This shows the countries – ranked by the current Debt to GDP ratios – from high to low. 3 countries have been highlighted in yellow as their figures have been originally shown in their own currencies. For the sake of comparison these figures have been converted into EUR.
Assumptions
- The current debt will remain constant for the next 15 years. Debt that falls due for redemption is rolled over – no new additional debt is assumed.
- The criteria in 2032 is that the debt is 60% of the GDP at the end of 2032
- The current debt is assumed to be 60% of the GDP at the end of 2032
- Projected GDP at the end of 2032 is adjusted so that it is a factor of 1.67 larger than the debt
- A constant annual growth rate is determined whereby the existing GDP at the end of 2017 will constantly grow to equal the expected GDP at the end of 2032.
Results
The top 7 countries have debt ratios around 100% or higher of GDP at the end of 2017. The constant annual growth rates that they would have to achieve under the scenario shown above are all greater than 3% per annum.
Annual growth rate since 1996 for the EU have averaged 1.7% – before the financial crisis there was an annual growth of 2.5%. For the last 10 years since the crisis, the average annual growth rate within the whole EU is just 0.8%. Even in 2017, the growth was just 2.5% – back at the same level as before the crisis. The data for this part came from tradingeconomics.com
It would be appear to be presumptuous to expect future annual GDP growth to consistently exceed the current long term trend. Of course this is a scenario relying on only 1 factor – namely growth in GDP to meet the 60% criteria – whilst ignoring any other possible factors.
Conclusion
As constant growth, as shown above is, not realistic, then other factors will have to come into play if the long term scenario relating to debt criteria is to be achieved. If not through growth, then either through increases in Government receipts (more taxes or selling of national assets) or decreases in Government expenditure (less subsidies, pensions, smaller investments).
Or……………..through fiscal union leading to transfers from the “richer” countries.
Next we will look at the history of fiscal transfer within the EU.
If you want more information please feel free to contact us via email [email protected]