
Partner Interview | Manipulating market-leading data to navigate volatility
11-05-2021 | treasuryXL | Refinitiv |
As a leading financial markets data provider, Refinitiv is an essential partner for corporate treasurers. Refinitiv’s global, multi-asset and multi-jurisdiction view of risk, credit and economic data enable treasury teams to drive stability by managing the global and interconnected nature of risk today.

⬇️ ⬇️ ⬇️
In this interview, we take a look at how Refinitiv’s corporate treasury customers used Refinitiv data and apps to remain agile and proactive in one of the most volatile years ever. We also consider what data is likely to be needed as we recover from the pandemic and companies seek growth.
An introduction to:

Director of Corporate Treasury Proposition, Refinitiv, an LSEG business

Proposition Sales Specialist for Enterprise Solutions, Refinitiv, an LSEG business.
INTERVIEW
1. From your data, what can be identified about the behaviors and activities of corporate treasurers during the onset of the pandemic?
Using the data we have available, we’ve been able to discern three broad phases of corporate treasury response and action throughout the pandemic. The period March through to May 2020 represents Phase 1, which for many Corporates could be termed the ‘Survival Phase’. During this first phase, we witnessed pronounced patterns of activity amongst our Corporate Treasury clients.
Firstly there was a strong focus on analysing and reviewing the Credit Risk of suppliers, clients and also corporate’s own credit risk. Treasurers wanted to know if their customers would be able to pay for the goods and/or services they are supplying, and if their suppliers were still going to deliver supplies, raw materials, component parts, goods, etc.
We also saw a spike in usage of Company Fundamental Data (app for company financial analysis, for financial statements and valuation metrics for over 90,000 companies listed on 169 exchanges in 150 countries), especially so for balance sheets, income statements, key ratios and Cashflow data. Furthermore, there was an increased appetite for Private Company data, which almost certainly reflected a desire to review the health of the extended supply chain, a trend which has continued.
Finally, there was an increase in usage of Sector-specific Economic Indicator data, up 30% globally from Feb – Mar 2020 (this app allows users to search for any Economic Indicator, chart the history, export to Excel and view associated press releases). An increase was also seen in the use of Peer Analysis data (allows for the comparison of a company against its peers across a multitude of measures and variables), reflecting a demand for wider sectoral intelligence, as well as insight into how related companies were performing in such a stressed environment. Conversely, we also saw a decline in demand for ESG related apps and data, as well as data and apps relating to Libor transition. Libor transition in particular had been a high priority area for most corporate treasurers, but the economic shock brought on by Covid-19 pushed these onto the back burner during the ‘Survival Phase’.
2. What are the Data and App usage highlights from Phase 1?
- Globally, Credit Default Swap (CDS) data usage grew 115% in EMEA and Americas between February and March 2020. Asia showed a 155% rise in usage of this data during the same period. (The CDS Dashboard app provides comprehensive Streaming price coverage on major global Index and single name CDS from major market maker).
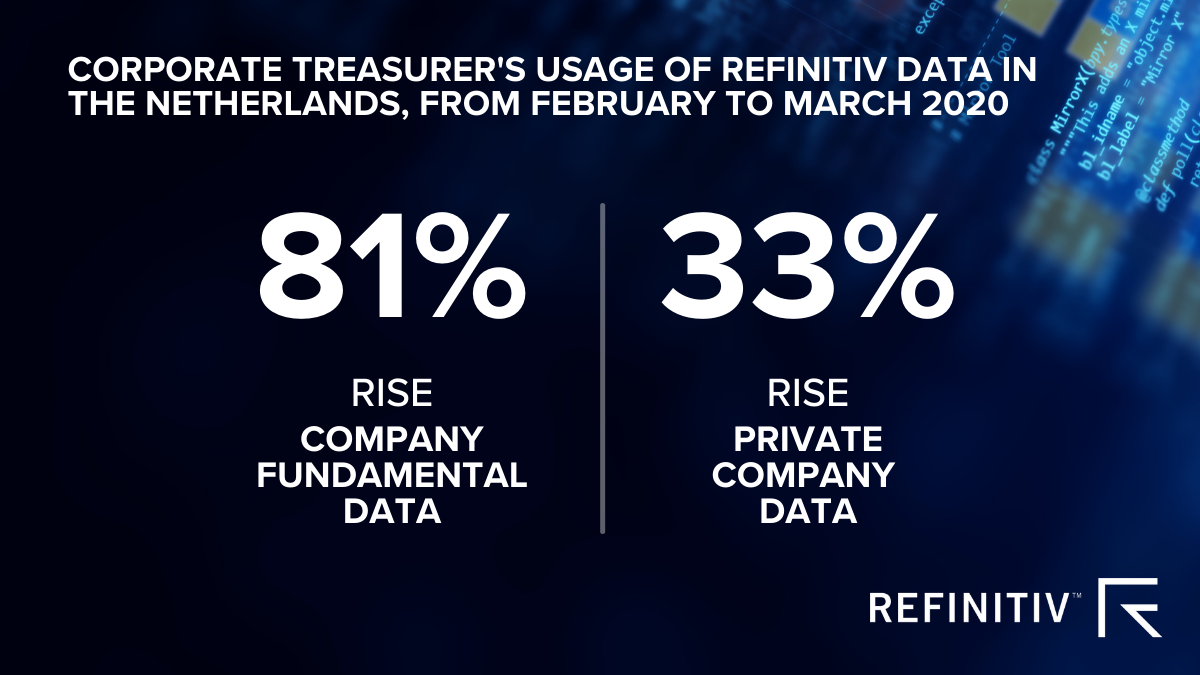
- In the Netherlands (February to March 2020), there was an 83% rise in usage by Corporate Treasurer’s use of credit and credit risk data, specifically;
- 68% rise in use of Debt Structure data (both for oneself and for one’s peers)
- 67% rise in Starmine Credit Risk data (Starmine Credit Risk models utilize industry-specific accounting ratios, equity market valuations and text mining models to produce a 1-100 score of an company’s credit risk).
- During the same period we also saw significant increases in usage of company fundamental and private company data. At the same time there was a clear drop in consumption of ESG data.
-
-
- 81% rise in Company Fundamental data
- 33% rise in Private Company data
- 45% drop in use of ESG data
-
- Looking at year on year data for the Netherlands for March 2020 and March 2021, we saw a 50% rise in CDS data; 50% rise in Debt Structure Data; 66% rise in Industry sector data; 113% rise in use of peer analysis apps.
- Furthermore;
- Private Company Data and Analytics grew by 31% between February to March 2020, receding during the summer months but then grew >100% from October 2020 into Q1 2021.
3. As the pandemic progressed, how did the behaviors and activities of corporate treasurer’s change?
Moving on from ‘Phase 1’ (above) and heading into ‘Phase 2’, which we can place from mid Q2 through to Q3 and call the ‘Cash Phase’, many companies focused on cash preservation and extending their cashflow runway as far as possible. Companies focused on maximising all sources of liquidity, in some cases working with suppliers to extend payment schedules and expedite receivables as far as possible. Companies also drew down reserves and utilised credit facilities. We also saw Bond Issuance accelerate significantly especially in Q3.
4. What are the Data and App usage highlights from Phase 2?
In the Netherlands, from June to October 2020, we saw a notable pick-up in usage of Issuance and Credit-related data and analytics:
- A 40% rise in usage of the New Issues Monitor – (app providing a comprehensive library of new issues covered by Thomson Reuters and supporting IFR).
- A more than 250% jump in usage of Starmine Credit Risk analytics and data
- A 25% rise in usage of the Fixed Income All Quotes app
At the same time, there were also further significant changes in usage of apps and data related to the financial health of the supply chain and the corporate ecosystem in general:
- Income Statement: Up 116%
- Balance Sheet: Up 72%%
- Key Ratios: Up 160%
- Cashflow: Up 175%
5. How do you see the behaviors and activities of corporate treasurers changing as we move into a recovery mode from the pandemic?
If we identify Phase 3 as the ‘Recovery Phase’, which focuses on positioning and planning for a return to normality, or at least a new normal, our usage data suggests that many companies continue to focus on bond issuance and refinancing in order to take advantage of current lower yields. It’s notable that issuance of US$ denominated debt by non-US companies has been particularly strong in the first quarter of 2021.
There are distinct trends apparent in the usage data for our issuance-related Data and Analytics apps, in particular:
- DCM Pricer – usage is up 21% from November 2020 to March 2021 (a custom bond calculator designed to build new bond issues and price them for the primary market)
- Debt Structure app – usage is up 20% between November 2020 and March 2021
- New Issues Monitor – usage is up 52% from November 2020 to March 2021 (New Issues Monitor provides a comprehensive library of new issues covered by Thomson Reuters and supporting IFR).
As countries navigate out of the pandemic, we can also see that ESG is firmly back on the agenda, with usage of our ESG apps and data rising strongly as we move deeper into 2021. For much of the pandemic period many companies focused on survival, but a rapidly developing global sustainability landscape is contributing to a significant shift towards adopting and ESG standards and behaviours across the corporate sphere.
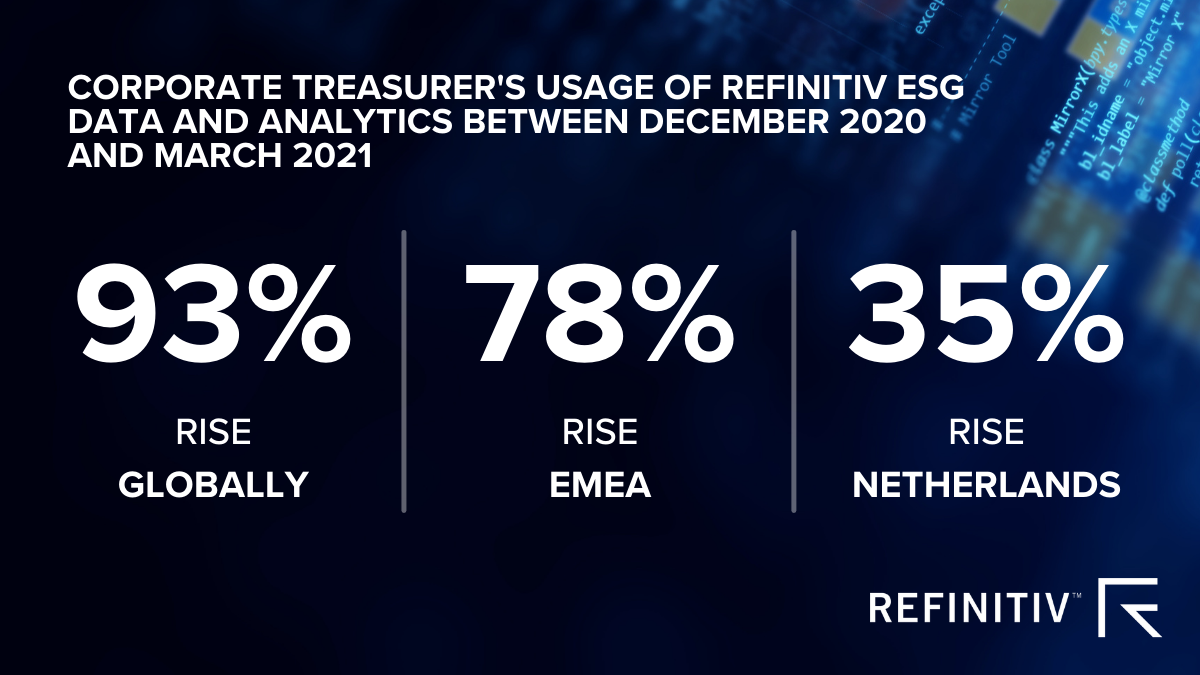
Globally, ESG Data and Analytics Usage has grown 93% between Dec 2020 and March 2021, higher than the pre-Covid-19 peak.
- Across EMEA, this was up 78% in the same period.
- In the Netherlands, although below the global and EMEA percentages, ESG Data and Analytics usage was still up 35% in the same period.
Looking beyond Covid-19, conversations with our corporate treasurer clients have revealed an appetite for greater visibility and predictability when it comes to cash and liquidity management. Aligned to this, is a desire for increasingly accurate forecasts and risk analysis regarding projected future cashflows. Hedge accounting and hedge effectiveness tools also feature strongly in these conversations.
Furthermore, automation to support more robust and frequent analysis and reporting, as well as a comprehensive enterprise-wide view of cashflow, risk and liquidity, are also areas of growing interest which are going to feature more in the post-pandemic landscape.
Finally, ESG data consumption has recovered and is now above pre-Covid-19 peaks. This trend is likely to continue on its upward trajectory, becoming systemically more prevalent than it was pre-pandemic, given the rapidly evolving regulatory and demand led factors which are driving an ever-greater focus on sustainability. We recently hosted an event with the Association of Corporate Treasurers on treasury ESG roles and responsibilities which you can watch on-demand here.
6. How can corporate treasurers gain access to Refinitiv’s market-leading data and navigate current and future volatility?
Serving more than 40,000 institutions in approximately 190 countries, Refinitiv provides advanced data and technology to help corporate treasury teams make critical decisions with confidence. Our corporate treasury solutions help deliver accurate and relevant data, tools and analytics that can be accessed easily and intuitively – advancing your end-to-end workflows and ensuring seamless integration with your entire treasury management eco-system.
To find out more, speak with our experts by completing your details here.
Read more about Refinitiv, an LSEG Business here.