Option Tales : Cheap Options part IIII

| 07-06-2016 | Rob Söentken |

banking


Today in the closing part of Rob Söentken’s Option Tales: When buying options it is tempting to see if the premium expenses can be minimized. A number of solutions are possible, which I’ve discussed in four articles. You can read about choosing the average rate option (ARO) and the conditional premium option in my previous article. In this closing part I will discuss the Reverse Knock Out (RKO) option. 

Reverse Knock Out (RKO) option

One of the most common options used as alternative to a vanilla option is the Reverse Knock out option. It is a vanilla option which ceases to exist after the underlying reference rate has traded through a certain level, the ‘trigger’ or ‘KnockOut’. This trigger event determination can be either

  • only at maturity (‘European’ trigger monitoring),
  • during the entire tenor (‘American’ trigger monitoring),
  • during on or more parts of the tenor (‘window’ trigger monitoring), or
  • on specific moments during the tenor (‘Parisian’ trigger monitoring)

The term ‘Reverse’ means that the option has been ITM before the trigger was hit. Just when the option was starting to make money it ceases to exist after the market touches the trigger. Unlike a vanilla option the value of an RKO is capped by a potential trigger event. Therefor RKOs are a usually a lot cheaper than vanilla options which have unlimited value potential.Schermafbeelding 2016-06-06 om 20.25.35

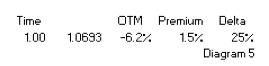
In diagram 6 an example is given of a 12-months USD call option costing 1.5%. Alternatively, one could consider buying an RKO option with same tenor and strike, with a European Knock Out trigger at 12.4% OTM. This costs 0.9%. There is only 8% chance the market is below the trigger at maturity. (The Delta of a vanilla option is 8%, which is also the chance of being below the strike at maturity). Therefor there is only 8% chance that the RKO expires worthless. Which could be a dramatic result for a hedge, especially considering the USD has appreciated by more than 12.4%, making the actual hedging cost showing a big loss. For a premium saving of only 0.6%.

So, to minimize premium expenses when buying options there are seven solutions to think about:
1. Choose Out of The Money strike (OTM)
2. Choose Shorter Tenor
3. Choose Longer Tenor
4. Compound Option
5. Average Rate Option (ARO)
6. Conditional Premium Option
7. Reverse Knock Out option (RKO)

Rob Soentken


Rob Söentken

Ex-derivatives trader

Best read articles of all time – FX Swaps vs Libor and EURIBOR: Arbitrage opportunities?

| 10-05-2018 | Rob Söentken |

fxswaps

As we are getting closer to the end of the month, end of Q2 and end of H1 of 2016, it is interesting to see financial markets are maneuvering to get the right liquidity on board for the balance sheet. Or get rid of the unwanted liquidity. For firms with liquidity in various currencies the best means for liquidity management is FX swaps.

What is an FX swap?

In a very simple definition the FX swap is like an exchange of deposits. The big advantage is that the counterparty risk is reduced due to the exchange of notional. Operationally an FX swap is booked as two FX transactions: one to convert and another to revert. The conversion rate is against the prevailing exchange rate. The reversion rate is against the conversion rate plus or minus some ‘swap points’, which reflect the interest rate differential between the respective currencies. During the tenor the exchange rate could change, which creates counterparty risk on the mark-to-market value of the reversion. Mark-to-market risk for tenors up to 1 year is still a small when compared to full notional risk.

How would an FX swap work in theory?

In diagram 1 the Libor and Euribor fixings for USD and EUR are listed for the respective tenors. 
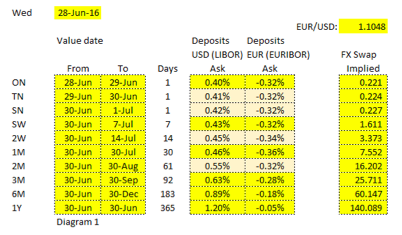
Now if we would consider exchanging a USD deposit versus a EUR deposit for 1 year the cash flows would be as follows:
For the conversion date we take value spot (ie 2 days, in this case that is per June 30th) and we agree to exchange EUR 1 Mio vs USD 1.1048 Mio (because EUR 1 Mio at current spot of 1.1048 is USD 1.1048 Mio)

For the reversion date we take the value date for 1 year from today’s spot date. We calculate the following amounts including interest:

EUR 1 Mio x (1 + -0.05% x 365 / 360) =                     EUR 999,493.06

USD 1.1048 Mio x (1 + 1.20% x 365 / 360) =         USD 1,118,241.73

Dividing the USD amount by the EUR amount gives the exchange rate for the reversion on the forward date, in this case that is 1.1188089. This is called the ‘forward rate’ The difference to the spot exchange rate is 0.0140089. For simplicity reasons this is multiplied by 10,000 to 140.089. This reflects the interest differential.

When executing an FX swap the EUR amounts are kept constant for both the spot and forward dates. But the USD amounts are calculated using the spot and forward exchange rates as calculated above. Therefor the interest differential is reflected in the USD amount being different between spot and forward date.

How does it work in reality?

As I mentioned at the beginning of this article, the current situation is special because we are getting close to a date special and important for balance sheet reporting. Supply and demand may push the market in a direction.

When looking at the actual FX swap rates and taking the EUR Euribor fixings as given, we can deduce the implied USD funding rates (see diagram 2). First observation is that the FX swaps appear to reflect either a substantial demand for USD from June 30th to July 1st, or a EUR supply. It is interesting to see that the 1 week fixing for EUR was not affected, while the 1 week FX swap was affected maybe 20 bppa. One reason could be the timing of the rates. Euribor is taken at one moment during the day, while FX swaps are affected by events during the day. Because wdiagram2
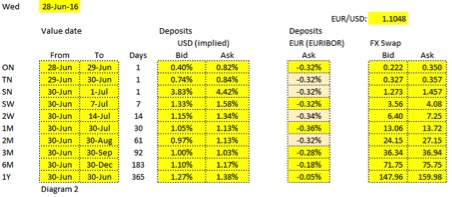
e are looking at a single day FX swap, the annualized rate could swing a lot.

Another observation is that the interest rate differential between EUR and USD is actually bigger than implied by the fixings. For one month tenor the difference is 0.59% p.a.. It would seem possible that supply – demand forces can push FX swaps away from the deposit markets. Likely the counterparty limit constraints on pure deposits keep them from being arbitrages vs FX swaps, like they used to be many years ago.

How can a treasurer benefit from FX swaps?

Each individual and organization should determine for itself what he/she or it needs. And I do not want abstract from discussions around documentation requirements, collateral financing and administration, and the operational extra work. It seems obvious that there are opportunities to investigate.

One key area would be to look at the bid-offer spreads on cash liquidity in various currencies as provided by house-banks and compare those rates with and without using FX swaps. Also I could imagine non-house banks could be more competitive in providing FX swaps, while the counterparty risk is substantially smaller than when pure lending is concerned.

Rob Soentken

Rob Söentken

Ex-derivatives trader


Uitgelicht: Staat haalt in 12 minuten €1 mrd op met heropening staatsobligatie

| 03-10-2016 | Rob Söentken |

mcckinseywarrenbuffet-600x600
Het beleid van de Nederlandse overheid richt zich op het verhogen van de gemiddelde looptijd van de financiering. Van 5.5 naar 6.5 jaar in 2019. Het openen van een lange lening draagt daar aan bij. Toch vraag ik mij af waarom gekozen wordt voor het heropenen van een stokoude lening. De coupon ligt inmiddels ver, ver boven de marktrente. Daardoor is de (emissie) koers meer dan 70% boven leningen waarvan de coupon wel in de buurt van de marktrente liggen.


Er zijn echter geen leningen van vergelijkbare looptijd met marktconforme coupon. Een reden kan zijn dat de agent de liquiditeit van uitstaande leningen wil verbeteren. Zitten er misschien andere redenen achter deze emissie?
In 1997 gebeurde als ik me goed herinner iets soortgelijks, maar omgekeerd. Toen KOCHT de staat obligaties ver boven 100%. Een verklaring die destijds werd gegeven door analisten was als volgt: Enerzijds kwam het verlies ten opzichte van de boekwaarde (100%) ten laste kwam van het begrotingstekort. Ten tweede werd door de terugkoop de uitstaande schuld terug gebracht. In 1997 waren meerdere landen druk bezig hun financiële plaatje in lijn te brengen met het verdrag van Maastricht.
Deze doelen voor begrotingstekort en uitstaande schuld (debt) stonden op respectievelijk <3% en <60% van het GDP. Nederland zat toen met een tekort van 1.5% ruim binnen de norm. Echter de uitstaande schuld was ruim boven de 60% van het GDP gekomen. Dus door de terugkoop transactie verschoof Nederland een stuk verlies van de balans naar de resultatenrekening.
Terug naar 2016. Wordt het bedrag boven 100 als financieringsmeevaller geboekt in 2016? En gegeven de groeiende economie kunnen we de staatsschuld best iets laten meegroeien? Een meevaller van EUR 700 Mio is wel heel veel geld. Maar als de boekhouders akkoord zijn zou ik het tijdens een verkiezingsjaar zeker niet laten.
Rob Soentken

Rob Söentken

Ex-derivatives trader

bron: FD.nl

Managing interest rate and liquidity risk

| 06-09-2016 | Rob Söentken |

skyscrapertxl


Funding is one of the key focus areas of a treasurer. There are numerous dimensions to funding:
1. Assessing amount and timing of cashflows
2. Arranging access to funding
3. Developing and implementing hedging policy
4. Optimizing funding cost and risk

Assessing amount and timing of cashflows

Assessing the amount and timing of cashflows is a continuous process. Because needs can change both in short and long term.

Arranging access to funding

Matching funding needs with supply from financial institutions is also a continuous process. The typical approach would be to match tenors, but immediate access to cash is critical for the survival of any entity. It could be considered to arrange longer term financing, even for short term (revolving) funding needs. The downside is that long term access is more expensive than short term access. This may be acceptable, but if the spread between borrowing and lending excess cash is too wide, it will become very unattractive to borrow for long tenors.

Developing and implementing hedging policy

To ensure the treasurer works within the boundaries of his mandate, he has to develop a hedging policy which must be documented (‘on paper’) and approved by his management. The document should describe the whole area of funding, to ensure both the creation and hedging of risks are described.

Optimizing funding cost and risk

The main focus drifts towards reducing funding cost. The funding market typically has a steep cost curve, meaning that rates are higher for longer tenors. This results from a steep ‘risk free’ curve and / or from a steep ‘credit spread’ curve. Which often brings entities to borrow for the cheapest tenor possible, being monthly, weekly or even overnight funding. Funding for very short tenors creates the considerable risk that can cause a company to run into a liquidity crisis, in case access to funding disappears. How to deal with this dilemma?

The best approach is to define a number of scenarios to assess the impact of combinations of financing and hedging on funding and risk. A base scenario could be to finance all funding needs using overnight loans. In case of liquidity problems, what would be the impact on the funding rates? Another scenario would be using quarterly funding or yearly rollover funding, potentially combined with:

  • money market futures
  • interest rate swaps
  • caps / floors
  • bond futures or even
  • credit derivatives

What are the incremental funding cost? What are incremental operational expenses of running various products? Can the entity deal with managing margin requirements? Is the entity aware of the basis risks involved when using credit derivatives, which are fairly complex products?

Rob Soentken


Rob Söentken

Ex-derivatives trader