7 steps on how to make Cash Flow forecast a success
| 15-02-2021 | Bas Kolenburg
Last year was a good example to remind organizations that cash flow forecasting is important, although, very little were prepared for the unprecedented, sharp and abrupt changes in turnover and cash flow due to the Covid-19 pandemic.
CFO’s have been asking:
- Where is the cash?
- Are we prepared for all the contingencies?
- Do we know how our cash flow will hold up for the rest of the year?
- Will we meet the covenants set in our credit facilities?
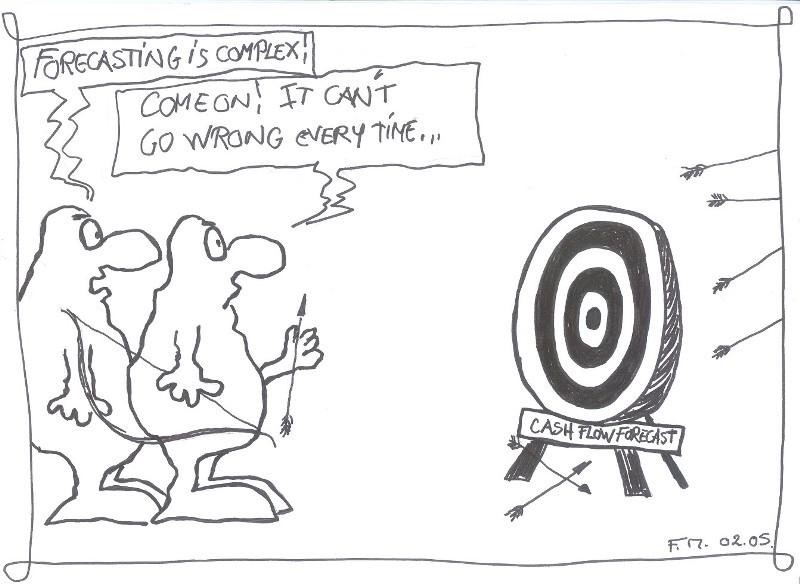
In many treasuries, cash flow forecasting is a well-established basic core process, but from my experience it is often a “struggle” where the results do not always outweigh the efforts. Why is this process so difficult and more importantly: how can you make the cash flow forecast process a success?
Here are 7 steps that will help your organization:
1. Set your purpose and the horizon
Allow yourself to describe what the purpose of the cash flow forecast is as this will define also the horizon and the data that you need to build your forecast. The purpose will also be the guiding framework what level of tolerances you are prepared to accept.
Setting up a cash flow forecasting for quarterly reporting of covenants or to prepare for short term liquidity shortfalls means a different horizon and sometimes also a different set of data. Horizons can vary as much from the ‘standard’ 13-weeks to monthly or quarterly to even years. With a longer horizon, the level of accuracy will diminish.
2. Identify the cash flow drivers
This is the most essential and valuable step in the process as the right identification will largely determine the success of your forecasting.
-
- Where and when do we receive cash inflows and what will be our expected cash outflows?”
- From what sources can we derive the data, how predictable are they, in what currencies?
- And in which entities or what bank accounts will these cash flows occur?
Prepare a list of all (forecasted) cash in- and outflows and label them with priority, currency, predictability and identify in what entity and from what source you will be able to find actual and forecasted data.
3. Collect systematic and consistent data from all cash flow drivers
As you have, in the previous step, identified what will drive your cash flow, then we reach the really difficult part and that is obtaining reliable data on actuals and forecasts on these drivers.
You often hear : “I do not know when our clients will pay our invoices” and “If we win the tender then contract turnover will be X, however timing of the tender and outcome is unsure” and “Forecasted volumes of our product, I can give you but prices will be determined at the sale on spot basis”.
Don’t confuse sales and profit with cash. Most organizations seem very well equipped and organized to close each accounting period their books and forecast somehow the main profit and loss items going forward, however translating that into cash items, in the right currency with the right timing is not always easy.
My experience is that the process of obtaining these data gives you great insights on how cash driven the company really is and what role cash is playing in the KPI and rewards throughout the organization. You will often find that cash is, except for the treasury responsible, not on top of each minds.
Find also the right balance in detail of the data you want to forecast, as you can define a lot of cash flow categories, but that also means that you will need to label your actuals for all these categories. Manual labelling is often undoable (unless you have unlimited resources) and automating this labelling with tools is often easier said than done.
4. Focus on cash balance visibility
Your starting point for your cash flow forecast is the cash balance you have today and without adequate cash balance visibility on your today’s cash balance you will not be able to project future cash balances. Cash visibility means that you have access to – real time- information of all cash balances in your organization. When you have 1 or 2 banks, the Electronic Banking tools of these 1 or 2 banks will provide you all the information that you need. However, often certain bank accounts are managed on a decentralized level and information on these accounts are provided only at the close of the reporting period. Multi-banking tools that function as an information overlay can help you to overcome these kind of situations but you can also set up you own cash balance reporting consolidation.
5. Include analysis for variances
Analyzing the actuals versus your forecasts gives you a better insight how well the predictions have been and which data were reliable in the previous forecasting period and which were not. The sources that provided these data need to receive feedback on the variances from you to understand what was causing this difference so that their data can be improved going forward. Otherwise, it is only your problem. Sometimes a sort of “carrot and stick” feedback can be used to strengthen the reliability of the data collecting and create co-ownership for the process.
6. Prepare for scenarios
For treasurers, being prepared for the unknown is part of their DNA. So setting up scenario’s next to a base case in the cash flow forecast is essential to understand the headroom and even more important, what are the main drivers affecting the headroom. Because one thing is certain: Covid-19 will not be the last crisis they we will face.
7. Let systems work for you
There is no one-size-fits-all solution. Each process and tool must be tailored to the needs and objectives of each specific business. Many organizations work with Excel sheets because of the flexibility, it’s easy to use, the low costs and because it can manage massive amounts of data. Basically there is no problem with that, except when you would like to follow the steps, I described above, in more complex and multi-currency environment, then Excel will fall short to “let systems work for you”.
Nowadays there are multiple solutions (in various price ranges) for tools that can support your cash flow forecasting process from dedicated cash flow forecasting tools to more generic treasury systems and also payment hubs and banks provide (parts of) the solutions to support the cash flow forecasting process. Sometimes the tools include also artificial intelligence features that use actual company data to determine and support the forecasts. But often the tool is just a blank template sheet that needs to be filled with the actual and forecasted data. Then the added value is limited as “garbage in” means often also “garbage out” .
Conclusion
My advice is to revisit the cash flow forecast process in your own organization with the above mentioned 7 steps. If not ideal, there might be a strong business case to change (parts) of the process to be better prepared for the future.
Bas Kolenburg


