How long should I fix an interest rate?
| 04-07-2016 | Lionel Pavey |
 A normal yield curve is usually upward sloping with diminishing increases in yield– the longer the tenor, the higher the interest rate. Generally it is assumed that longer maturities contain larger risks for lenders and they require adequate compensation with a risk premium in the form of a liquidity spread.
Any long-term corporate investment (purchasing of plant and/or equipment) will need to be financed.
Normally if an asset has a service life of 15 years a loan would be arranged whereby the tenor was also 15 years. Assuming straight line depreciation of the asset then the annual principal repayment would equal the annual depreciation in the bookkeeping. So whilst we could then conclude that the ultimate tenor of a loan should equal the service life of an asset, it still does not answer how we should finance it.
Since January 1999, with the introduction of the Euro, it has become easier to collate data relating to interest rates on a daily basis. On the basis of working days (so days where rates will be traded and then published) there have been over 4,400 dates from which data could be collected. A daily array of interest rates both short and long term implies that it is not inconceivable that more than 75,000 individual data points could have been collated by now – perhaps a lot more depending on your appetite for data. It would be fair to say that this would represent a substantial array of data that could be analyzed.
Let us make the following assumptions:
- We have access to this data
- It contains all Euribor rates
- It contains long term interest rate swap rates
- We wish to compare long term fixed funding with short term funding
- Short term funding is not only against Euribor but also shorter date long term swaps that have a maturity smaller than the long term fixed funding period
- All trades can take place at the rates that we have captured and collated
- The long term maturity is a fixed number of whole years
- The short dated long term swaps are also a fixed number of whole years
- We ignore the NPV of the cash flows
- The short dated long term swaps are factors of the long term maturity
- Interest payments on all interest rate swaps is annually
If we were to analyse 10 year fixed rates against shorter dated rollover funding we can compare it against periods of 1, 3 and 6 months as well as 1, 2 and 5 years.
The following is an analysis of data from the 4th of January 1999 up to and including the 31st May 2016.
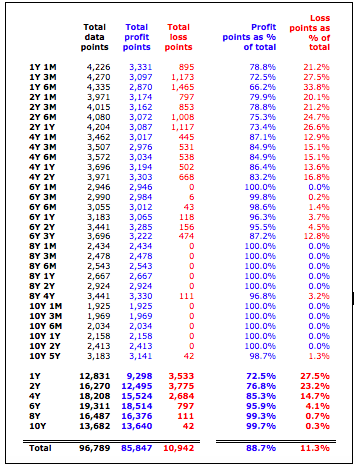
Observations:
- This overview is compiled as of the 31st May 2016.
- If we look at 10Y (fixed) versus 1Y (fixed) rollover we see there are 1,925 data points.
- If we look at 10Y (fixed) versus 5Y (fixed) rollover we see there are 3,183 data points.
- The last date that we can calculate for 10Y against 1Y is 9 years before the 31st May 2016 – 31/05/2007
- The last date that we can calculate for 10Y against 5Y is 5 years before the 31st May 2016 – 31/05/2011
Whilst interest rates have fallen since the crisis that started in the summer of 2008, rates were “normal” for the preceding 9 ½ years since the inception of the Euro in 1999.
Here is a graph of 1Y and 10Y IRS rates since 1999 –
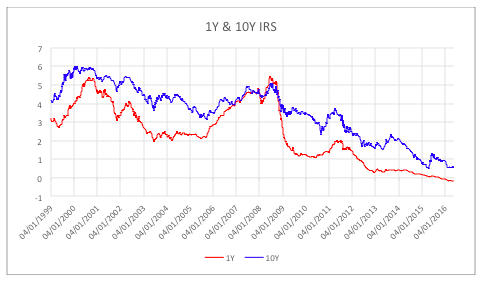
As is to be expected the 10 year yield is normally higher than the 1 year yield – this follows the accepted theory for interest rates.
For further analysis here is a graph of 1Month Euribor and 5Y IRS rates since 1999 –
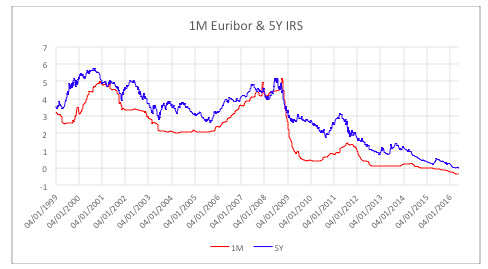
Yet again, as expected, the 5 year yield is normally higher than the 1 month yield.
So whilst the data produces normal curves whose general shape and distribution meet the expected theories of interest rates, regardless of the absolute value at any particular time, the analysis of the data shows that, in most cases fixing rates for a shorter term leads to lower interest charges than immediately fixing for a longer period.
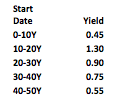
Naturally, with the extremely low interest rates that are prevalent at the moment, it would be very naïve to conclude that interest rates should always be fixed for a shorter term than the desired tenor for the longer term. However, as mentioned in one of my previous articles about implied forwards, it is necessary to look at all the implied values within a curve at the time that a loan needs to be arranged.
A quick and dirty inspection of the yield curve at the moment would show that, if we were looking at a constant 10 year yield curve priced off IRS, the implied curve would look like this at certain points –
Now we need to quantify the savings that, theoretically, could have been obtained by looking at our original data.
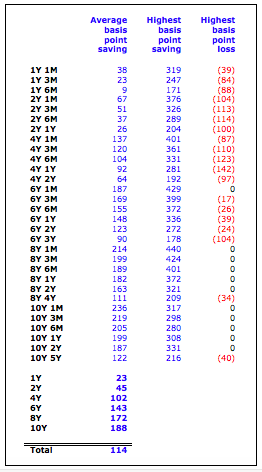
As can be seen, a 5 year rollover fixed at inception and then refixed after 5 years as opposed to a 10 year fixed at inception led to an average reduction in interest costs of 122 basis points per annum and would have been the better option in 98.7% of the time.
There are no guarantees about prices in the future, but a lot more implied data is available in the current yield curve than just that one single curve that is shown as a graph in the newspapers.

Cash Management and Treasury Specialist – Flex Treasurer