Tag Archive for: Bonds

Interest payments – How to calculate the days

| 07-03-2018 | Lionel Pavey | treasuryXL | LinkedIn

When entering into a financial transaction you need to be aware of the settlement dates. If you have a contract that states that you must pay on the 1st day of every month what do you do when that date is a non-working day? Furthermore, to be able to calculate the interest owed on a loan, you also need to know what the denominator is – the number of days in a year for the particular product and contract. When a payment cannot take place on a particular date – because it is not a recognised business day, you need to know the convention that the bank uses to adjust the payment date. Here is an overview of the most commonly used business day conventions (which determine how non-business days are handled) and calculation bases.

Business day conventions | Modified Following

Preceding – the first preceding day that is a business day
Following – the first following day that is a business day
Modified Following – the first following day that is a business day, unless the days falls in the next calendar month, in which case the date will be the first preceding day that is a business day

Furthermore reference will be made to the applicable currency calendar for determining non-working days. For EUR this would mean TARGET, for GBP this would mean London, for euro USD this would mean London and New York.

Calculation basis

Actual/360 (Money Market) – the coupon payment is calculated using the exact number of days in the period divided by 360. The start date is included in the calculation, but not the last day.

Actual/365 (Fixed) – the coupon payment is calculated using the exact number of days in the period divided by 365. The start date is included in the calculation, but not the last day

Actual/Actual (ISDA) – the coupon payment is calculated using the exact number of days, with the portion of days belonging in a non-leap year divided by 365 and the portion of days belonging in a leap year divided by 366. The start date is included in the calculation, but not the last day.

Actual/Actual (ISMA) – the coupon payment is calculated using the exact number of days divided by the length of the year, where the length of the year is equal to the number of days in the coupon period multiplied by the number of coupon periods in the year.

30/360 (Bond basis) – the coupon is calculated over 30 days for every full calendar month and the actual number of days for the remaining fraction of a month, divided by 360.

30/360E (Eurobond basis) – the coupon is calculated on the basis of a year of 360 days with 12 30-day months, unless the end date is the last day of February, which is not lengthened to a 30-day month.

Coupon calculation conventions

Adjusted – Interest is calculated on the effective payment date adjusted for the business day

Unadjusted – Interest is calculated on the theoretical payment date, regardless of the effective payment date.

If you are interested to know what the effect of these changes can be on a coupon payment and calculation, please contact us for more detailed information.

Lionel Pavey


Lionel Pavey

Cash Management and Treasury Specialist


Rising bond yields – winners and losers

| 25-04-2018 | treasuryXL |

It is the talk of the town – US 10 year Government bond yields are rising and testing the perceived psychological level of 3 per cent. At the same time the whole yield curve is flattening – the spreads are diminishing. There are growing concerns about rising inflation, along with fears of trade wars and rising oil prices. When the threat of inflation occurs, there is a selloff in bonds and their yield goes higher. At the same time as the yield curve is flattening there is talk of the yield curve becoming inverted which, historically, is seen as the precursor to a recession. Conflicting signals – what does it all mean?

The rise in bond yields is a global trend – the same is being seen in Europe and the UK. In the last week data from the EU zone showed that the economy appears to be slowing down – or increasing at a slower rate than was previously seen. However the effects of Quantitative Easing programmes in the different countries has led to a great divergence in rates.

  • For the period from 1999 to 2008 the average 10 year bond yields were as follows:
  • Germany 3%
  • United States 8%
  • United Kingdom 8%


  • For the period from 2008 to 2018 the average 10 year bond yields were:
  • Germany 7%
  • United States 5%
  • United Kingdom 5%

However at present the yields are 0.6% for Germany; 3.0% for United States; and 1.5% for United Kingdom

It is clear that the due to this large divergence the effects of rising US bond yield will have a very large impact on bond yields in other countries and the exchange rates.

Recession?

Classical economic theory states that inverted yield curves are a sign of recessions and down turns in the economy. Yield curves invert when the short term rates exceed the long term rates. However an inverted yield curve is not the cause of a recession. As the Fed has been pursuing a policy of gradual interest rate rises, it is not unrealistic to expect that to lead to a tightening over the whole curve. As investors expect short term yields to rise – leading to an eventual rise in long term rates – their area of focus changes and they position themselves by selling long dated bonds, causing a rise in long dated yields.

At the same time market analysts are saying that the global economy has reached a new departure point – there has been a significant shift in interest rate perceptions and that whilst rates can and will rise, they will not revert to the mean. However, as investors chase yield a major rise in US bond yields will impact on other bond markets. When the US bonds are yielding 400% more than their Eurozone counterparts, there are serious worries that investors will flock to the US market, unless the ECB announces the end of QE, which would lead to rising Euro yields.

There is also a possible knock on effect to the equity markets. Rising bond yields suddenly make equities less attractive. It could be that volatility is about to return and that Treasurers will need to look at their hedging policies.

Are public debts sustainable?

| 19-02-2018 | treasuryXL |

A few weeks ago the EU Commission released a report on debt sustainability within the EU. It provides an overview of the challenges faced by member countries over the short, medium and long term to meet the original convergence criteria – specifically, that existing Government debt is less than 60% of GDP. As with most Government related documents it is long – over 250 pages. A lot of attention is drawn to the Debt Sustainability Monitor (DSM) and the challenges faced to achieve the abovementioned criteria by 2032.

Any forecast is open to different interpretations, especially one that looks 15 years into the future. At the end of 2017, 15 of the 28 countries within the EU (in other words more than 50%) have Government debt that exceeded 60% of GDP. The average ratio for all 28 countries – on the basis of the sum of all Government debt and all GDP – is 83%. Let us focus on those 15 countries who, currently, do not meet the criteria. The figures for this article have been taken from the following website – debtclocks.eu


This shows the countries – ranked by the current Debt to GDP ratios – from high to low. 3 countries have been highlighted in yellow as their figures have been originally shown in their own currencies. For the sake of comparison these figures have been converted into EUR.

Assumptions

  • The current debt will remain constant for the next 15 years. Debt that falls due for redemption is rolled over – no new additional debt is assumed.
  • The criteria in 2032 is that the debt is 60% of the GDP at the end of 2032
  • The current debt is assumed to be 60% of the GDP at the end of 2032
  • Projected GDP at the end of 2032 is adjusted so that it is a factor of 1.67 larger than the debt
  • A constant annual growth rate is determined whereby the existing GDP at the end of 2017 will constantly grow to equal the expected GDP at the end of 2032.

Results

The top 7 countries have debt ratios around 100% or higher of GDP at the end of 2017. The constant annual growth rates that they would have to achieve under the scenario shown above are all greater than 3% per annum.

Annual growth rate since 1996 for the EU have averaged 1.7% – before the financial crisis there was an annual growth of 2.5%. For the last 10 years since the crisis, the average annual growth rate within the whole EU is just 0.8%. Even in 2017, the growth was just 2.5% – back at the same level as before the crisis. The data for this part came from tradingeconomics.com

It would be appear to be presumptuous to expect future annual GDP growth to consistently exceed the current long term trend. Of course this is a scenario relying on only 1 factor – namely growth in GDP to meet the 60% criteria – whilst ignoring any other possible factors.

Conclusion

As constant growth, as shown above is, not realistic, then other factors will have to come into play if the long term scenario relating to debt criteria is to be achieved. If not through growth, then either through increases in Government receipts (more taxes or selling of national assets) or decreases in Government expenditure (less subsidies, pensions, smaller investments).

Or……………..through fiscal union leading to transfers from the “richer” countries.
Next we will look at the history of fiscal transfer within the EU.

If you want more information please feel free to contact us via email  [email protected]


Can it all be about the Treasury yield?

| 13-02-2018 | treasuryXL |

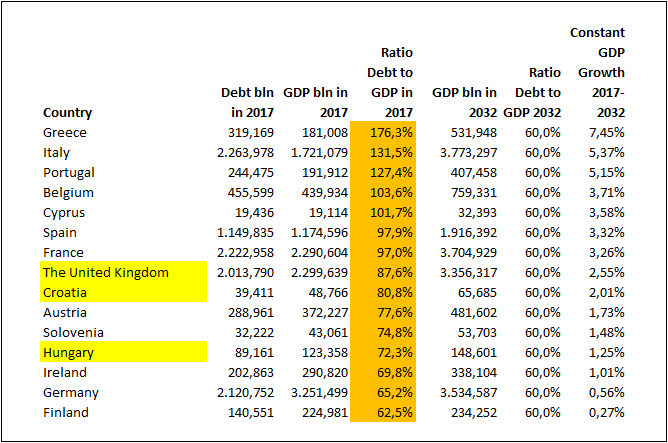
Since the beginning of February there has seen large declines in all the major stock markets – Dow Jones down 9%, AEX down 7%, DAX down 7%, FTSE down 5%. The major reason given is that the market has been disturbed by the thought that interest rates in the US will rise more quickly than previously expected as prospects of inflation come to the fore. Going counter to this thought is the explanation that stock markets achieved good growth in 2017 – all major markets were up with some growing by 15% – and that this is a bout of profit taking, before participants will buy on the dip.

There is a major rethink as to the predicted treasury yields for the end of 2018. The German 10year Treasury yield, which is seen as a benchmark in the Eurozone, had an average yield in 2017 of about 0.30%. In the first six weeks of 2018 this has more than doubled and the yield is now 0.72%. Reports that had been published at the end of 2017 are rapidly being updated as the predictions are adjusted for the reality of the current market. A quick look at the websites of major banks show a consensus that the yield could easily be 1% at the end of 2018.

As the German 10year Treasury is a benchmark for pricing other long dated instruments within the Eurozone, this implies that all other rates will be rising faster than expected. If we assume that spreads between Interest rate swaps (IRS) and Treasury remains fairly constant, this would imply that 10year EUR IRS will have a fixed rate around 1.50% by the end of 2018 having averaged around 0.80% for 2017.

Included is a graph showing the price movement of 10Y EUR IRS since start of 2017

At the moment headline inflation is remaining stable, but it appears that the market is expecting inflation to move higher in 2018. The increase in the yield of US 10 year Treasury rates has been more rapid than expected – at the moment the yield is almost 2.90%. It would appear that the increase in US rates is pulling other currency yields higher. Furthermore rises in US interest rates will have an impact on FX hedging policies for companies.

Treasury yields have been in a bull market for almost 40 years – in the early 1980s the yield on 10year German treasury was around 10%. This fell gradually and actually turned negative in 2016. Are we entering a new bear market?

Beware of Greeks bearing bonds

| 29-01-2018 | Lionel Pavey |

Over the last year there have been impressive price gains in Greek Government bonds leading to equally impressive falls in yields. Greek 2-year bonds are now yielding 1.35% – down from around 7% at the start of 2017. Similarly, 10-year bonds are now yielding 3.66% – a significant fall since the start of 2017. In fact, the yield on Greek 2-year bonds is now lower than in USA where the current yield is 2.09%. Last week S&P upgraded Greece’s long term credit rating to ‘B’ from ‘B-‘. It would appear that Greece is doing everything right. Right?

Well, looking at it from another perspective it is clear that Greece is not in such a strong shape compared to the USA. Unemployment in USA is 4.1% – Greece is about 5 times higher at 20.6%. Clearly there must be another reason for lower yields in Greece. Athens hopes to issue new bonds in 2018 with tenors of 3, 7 and 10 years.  The answer would appear to be the very low to negative yields on German debt. The yield on German 2-year bonds -0.57% and on 10-years 0.63%. As investors search for any positive yield they have been attracted to the Euro countries on the periphery – Greece, Spain etc.

The ECB have regularly said that they think inflation will remain below their target for the foreseeable future. This has encouraged investors to seek out alternative countries that are offering a positive yield. There is almost a 2% yield pick up on Greek paper over Germany. This has proven to be attractive even though Greek debt-to-GDP ratio stands at 190%.

However, EU creditors hold around 80% of existing Greek debt. As they are wary of Greece reverting to the problems seen a few years ago, issuing new bonds could be difficult. With all the promises made in the past to ensure bail-outs for Greece, the rest of the EU will be extra cautious and vigilant – leading to no easing of the current reforms and restrictions that the EU has put in place.

It would seem, therefore, that the market is temporarily out of synch. The market is being distorted by the fact that there is an appreciable yield pick up in EUR (so no FX risk) when looking at Greek bonds versus German bonds. There appears to be no other logical explanation as to why Greek yields are significantly lower than those in USA.

If bond markets turn sour this year, which would you rather hold – Greek or American paper?

Lionel Pavey


Lionel Pavey

Cash Management and Treasury Specialist


Why does Apple issue a green bond? Spoiler alert: I do not know (yet)

24-7-2017 | Pieter de Kiewit | treasuryXL |

Recently we had an “inner circle meeting” of treasuryXL in which we talk about developments and the direction we want to go. One of the invitees suggested we pay special attention to sustainable financing and related topics. I agree that this topic is quite prominent and this reminded me about a recent article in which a so-called “green bond issue” by Apple is described. This was the second issuance by them and raised $1 billion. Then my corporate treasury laymen’s mind started working and so far it has not stopped about this topic.

At the start of this year Apple was in the news because of the huge pile of cash in their books. The amounts are staggering and most likely not accurate. Repatriating this cash to the US would be suboptimal from a fiscal perspective but that is a topic for another blog. The funds raised with the green bond will be used to start projects around renewable energy and buying of safe raw materials.

The puzzle for me is: if you have all this cash, why would you do a bond issue? It is a lot of hassle, why not leverage the money you have? If you think this is a smart investment, why not invest yourself?

One of my colleagues suggested they do this from a marketing perspective. I don’t know about you, but I will not buy an Apple instead of a Samsung because of a green bond. So this is not the reason I expect. Perhaps it is a risk mitigation strategy in a project Apple will invest in anyway. My question to the corporate treasury and banking community: Do you know why?

Thank you for your answer and I will try to focus on other blog topics around sustainability and corporate treasury. I am convinced more obvious are available.

Pieter de Kiewit


Pieter de Kiewit
Owner Treasurer Search


Another interesting article about funding:

Business case – Funding strategy: how Fastned uses Nxchange

Long term or short term debt – your choices

|18-5-2017 | François de Witte |

You might visit this site, being a treasury professional with years of experience in the field. However you could also be a student or a businessman wanting to know more details on the subject, or a reader in general, eager to learn something new. The ‘Treasury for non-treasurers’ series is for readers who want to understand what treasury is all about. Today our expert François de Witte will explain de difference between long term and short term debt.

One of the main tasks of the treasurer is to ensure that the company has the required funds to operate. The treasurer will usually contact the banks for this funding. They can also extend long term loans (LT) or short term loans (ST).

Raising short term debt has several advantages, because it is more flexible, there is a lower cost due to the lower margin (smaller risk profile than long term debt) and usually lower interest, funds can be raised quickly and usually, you can repay your debt without penalty.

However, there are some drawbacks. The required repayment comes quicker than for LT loans, there can be potential difficulties in renewing short term loans, and it will be more difficult to combine ST debt with a fixed rate interest.

For this reason, many corporates take up long term loans. It helps them to improve the financial structure (better liquidity ratio). During the term of the credit facility, there is no renewal risk, and long term loans can be taken up with fixed or floating interest. Many banks will see long term loans as a prerequisite to finance fixed assets and investments.

In that case, the corporate will have to accept a higher price on these loans, a longer set up time and a possible prepayment penalty in case there is a fixed interest rate during the long-term loan.

Financing policy

The classic financing policy aims to match the maturity of the financing with the maturity of the assets. Under this policy, long term assets will be financed by long term loan, and short term assets by short term loans. An area of concern are the working capital needs. Are these to be considered as long term assets as short term assets? Usually the uncompressible part of the working capital need is considered as a long-term asset, whilst the fluctuating part (including the seasonal requirement) is considered as short term asset.

Some companies use a more aggressive financing policy and chosse short term financing to finance all the working capital needs, which can be risky. Others are more conservative and use long term loans to finance also the fluctuating part of the working capital needs.

Bank Financing versus bonds or Commercial Paper financing

Usually midcorporates and smaller corporates will use bank financing, also for the long-term financing, because it is easier to be set up. There is no need to have a complex prospectus or to ask for an external rating and there are less disclosure and reporting requirements. In addition, there is more flexibility in the repayment schedule, and it will be easier to negotiate a floating rate.

However larger corporates, those with an external rating or a large name recognition, will also consider bond or Commercial Paper financing. The bond financing will allow for longer term maturities, and the possibility to lock in the interest rate for longer periods. Bonds and commercial papers enable a diversification of funding sources, and can be traded in the market. In addition, there is no obligation provide side business to the lenders.

Bond financing

The world’s bond market can be divided into two broad groups:

  • The domestic bond market (issued in a country by resident issuers)
  • The international bond market (issued in a country or in the international markets by non-resident issuers). These also include the Eurobonds

Different bonds

The most common bonds are the straight bonds. In this case, the issuer issues securities for a fixed term with an annual or semi-annual interest payment at a fixed rate.

Example: Issuer A issues on 10/6/2017 EUR 100 Million debt at 6 % for 7 years.  In this case, the bondholders are entitled to receive an annual interest rate of 6 % (also called the coupon) on the 10th June of each year from 2018 until 2024, and the full reimbursement of the loan on 10/6/2024.

We also see quite frequently the issuance of Floating Rate Notes. This is a medium term or long term bond with a coupon based upon a floating rate based on a benchmark rate (e.g. Euribor or Libor) plus a “spread” based upon amongst others the credit quality of the issuer.

Zero-coupon bonds that do not foresee for periodic interest payments, but for the full reimbursement of the capital and interest at the final maturity of the bond.

Convertible bonds can be exchanged later or with another instrument, mostly shares.  The coupon is usually lower because of the option granted to the bondholder.

Public bonds are bonds issued by a bank syndicate through a public offering with prospectus. These bonds are focusing both on the retail and on the professional investors. They also must comply with the specific requirements for the prospectus, which sometimes needs to be submitted beforehand to the competent authorities for approval.

A private placement (or non-public offering) is a bond issue through a private offering, mostly to a small number of chosen investors. Private placements have less heavy constraints in term of prospectus.

Since 2000, the global bond markets size has nearly tripled in size. Today it is worth more than $100 trillion

(Source: Bloomberg, June 2016).

François de Witte – Founder & Senior Consultant at FDW Consult & Flex Treasurer

[button url=”https://www.treasuryxl.com/community/experts/francois-de-witte/” text=”View expert profile” size=”small” type=”primary” icon=”” external=”1″]

[separator type=”” size=”” icon=””]

More articles of this author:

Treasury for non-treasurers: Short term loans from a treasury perspective

Working capital management: Some practical advice on the optimization of the order to cash cycle

Management of bank mandates – EBAM – A lot of challenges

[separator type=”” size=”” icon=””]